14.3.100 SST, SSR, and SSE
Following are chest size and weight data for 8 randomly selected bears. Here, x denotes chest size, in inches, and y denotes weight, in pounds. Use the information to do parts (a) through (d).
\(\sum x = 396, \sum y = 2362, \sum xy = 118330, \sum x^2 = 19870\)Compute SST, SSR, and SSE, using the formulas, .
First we need to get the data from the question. (We can import it from Excel)
x<- c(55, 44, 46, 58, 40, 54, 52, 47)
y<- c(325, 253, 263, 340, 251, 315, 310, 305)
From formula sheet
\(S_{xx}=\sum(x_i-\bar{x})^2=\sum x_i^2-(\sum x_i)^2/n\)
\(S_{xy}=\sum(x_i-\bar{x})(y_i-\bar{y})=\sum x_iy_i-(\sum x_i)(\sum y_i)/n\)
\(S_{yy}=\sum(y_i-\bar{y})^2=\sum y_i^2-(\sum y_i)^2/n\)
Total sum of squares: \(SST =\sum(y_i-\bar{y})^2 = S_{yy}\)
Regression sum of squares: \(SSR=\sum(\hat{y_i}-\bar{y})^2=S_{xy}^2/S_{xx}\)
Error sum of squares: \(SSE=\sum (y_i-\hat{y_i})^2=S_{yy} - S_{xy}^2/S_{xx}\)
Regression identity: \(SST = SSR + SSE\)
Coefficient of determination: \(r^2=\frac{SSR}{SST}\)
Linear correlation coefficient: \(r=\frac{\frac{1}{n-1}\sum(x_i-\bar{x})(y_i-\bar{y})}{s_xs_y}\) or \(r=\frac{S_{xy}}{\sqrt{S_{xx}S_{yy}}}\)Names of variables
\(S_{xx}: Sxx\)
\(S_{xy}: Sxy\)
\(S_{yy}: Syy\)
First approach, we find SST, SSR, SSE without finding \(\bar x, \bar y\)
n = length(x)We have the same dataset from the question.
Find \(S_{xy}, S_{xx}, S_{yy}\)
Syy = sum(y*y) - sum(y)^2/n
Sxx = sum(x*x) - sum(x)^2/n
Sxy = sum(x*y) - sum(x) * sum(y) /nSxx## [1] 268Sxy## [1] 1411Syy## [1] 8373.5Find SST
SST = Syy
SST
## [1] 8373.5Round to two decimal places
round(SST,2)## [1] 8373.5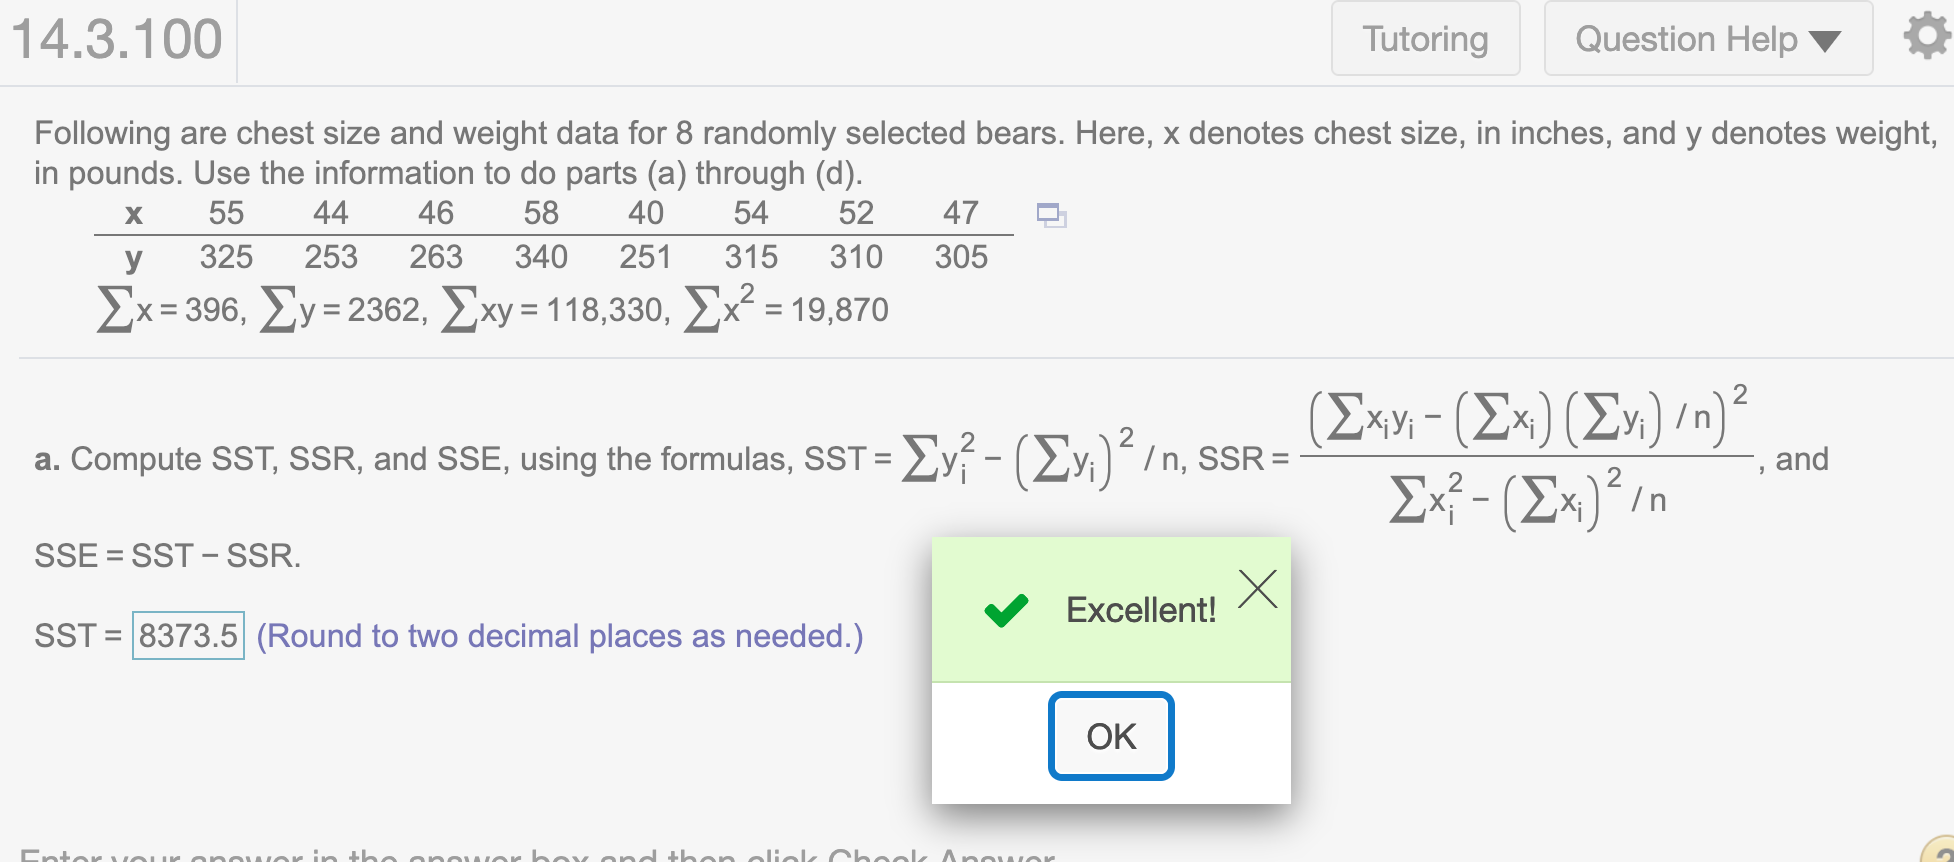
Find SSR
SSR = Sxy^2/Sxx
SSR
## [1] 7428.81Round to two decimal places
round(SSR,2)## [1] 7428.81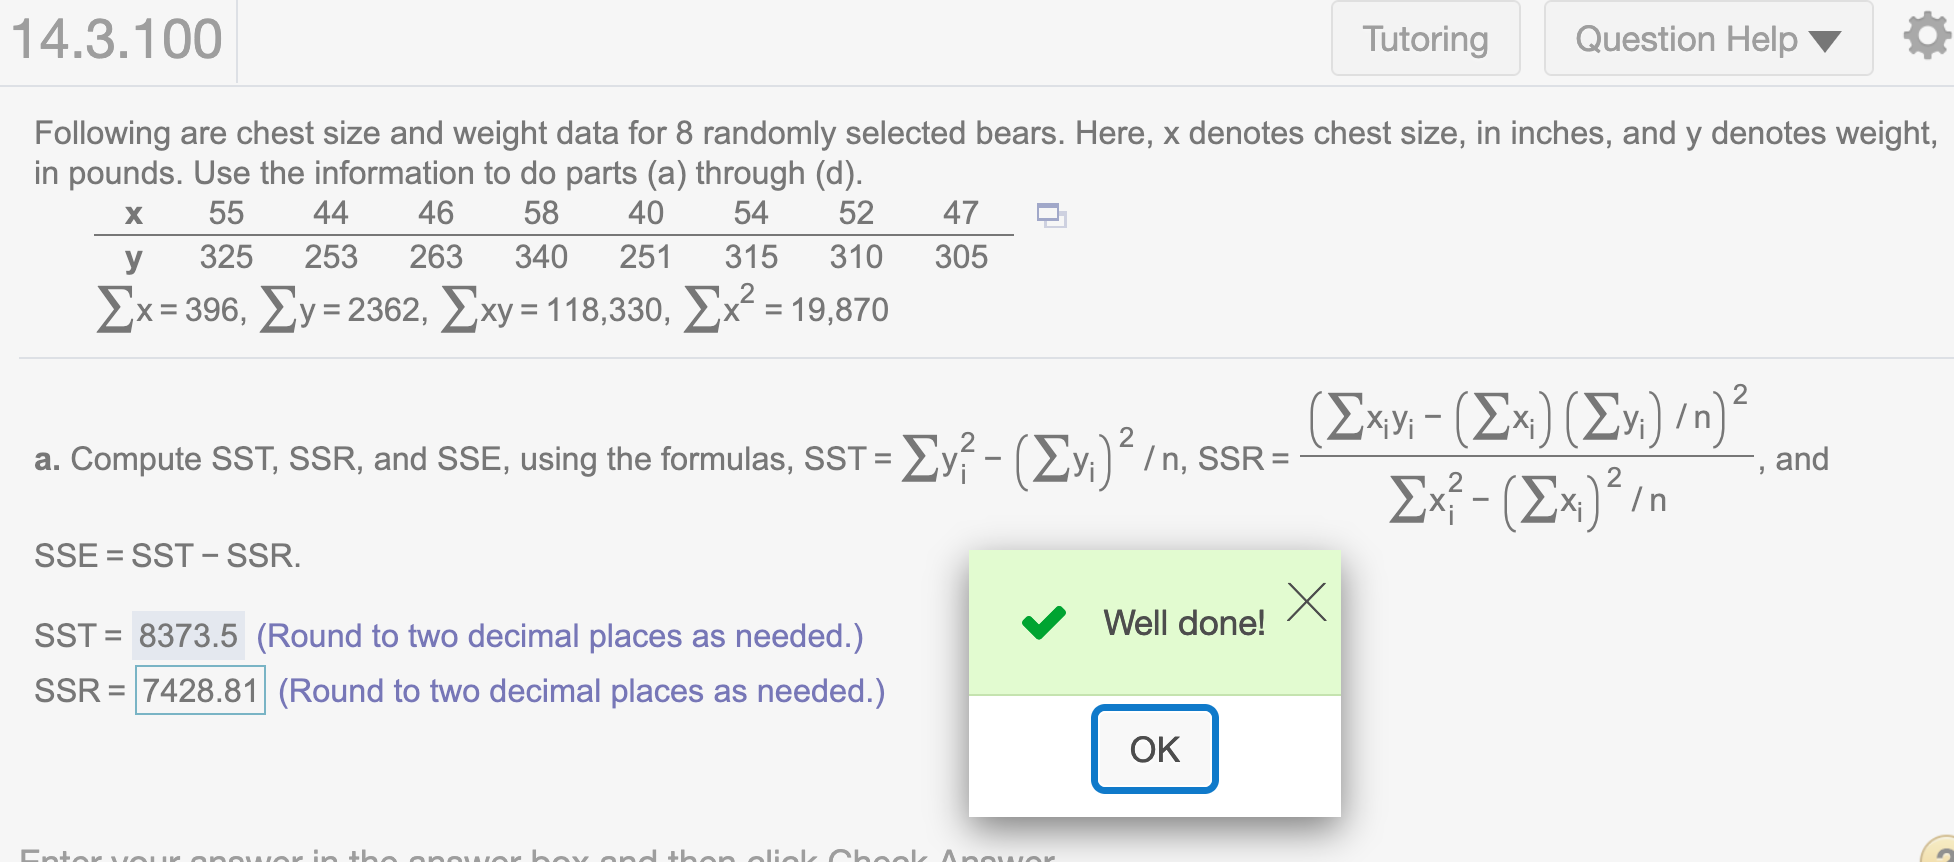
Find SSE
SSE = Syy - Sxy^2/Sxx
SSE
## [1] 944.6903Round to two decimal places
round(SSE,2)## [1] 944.69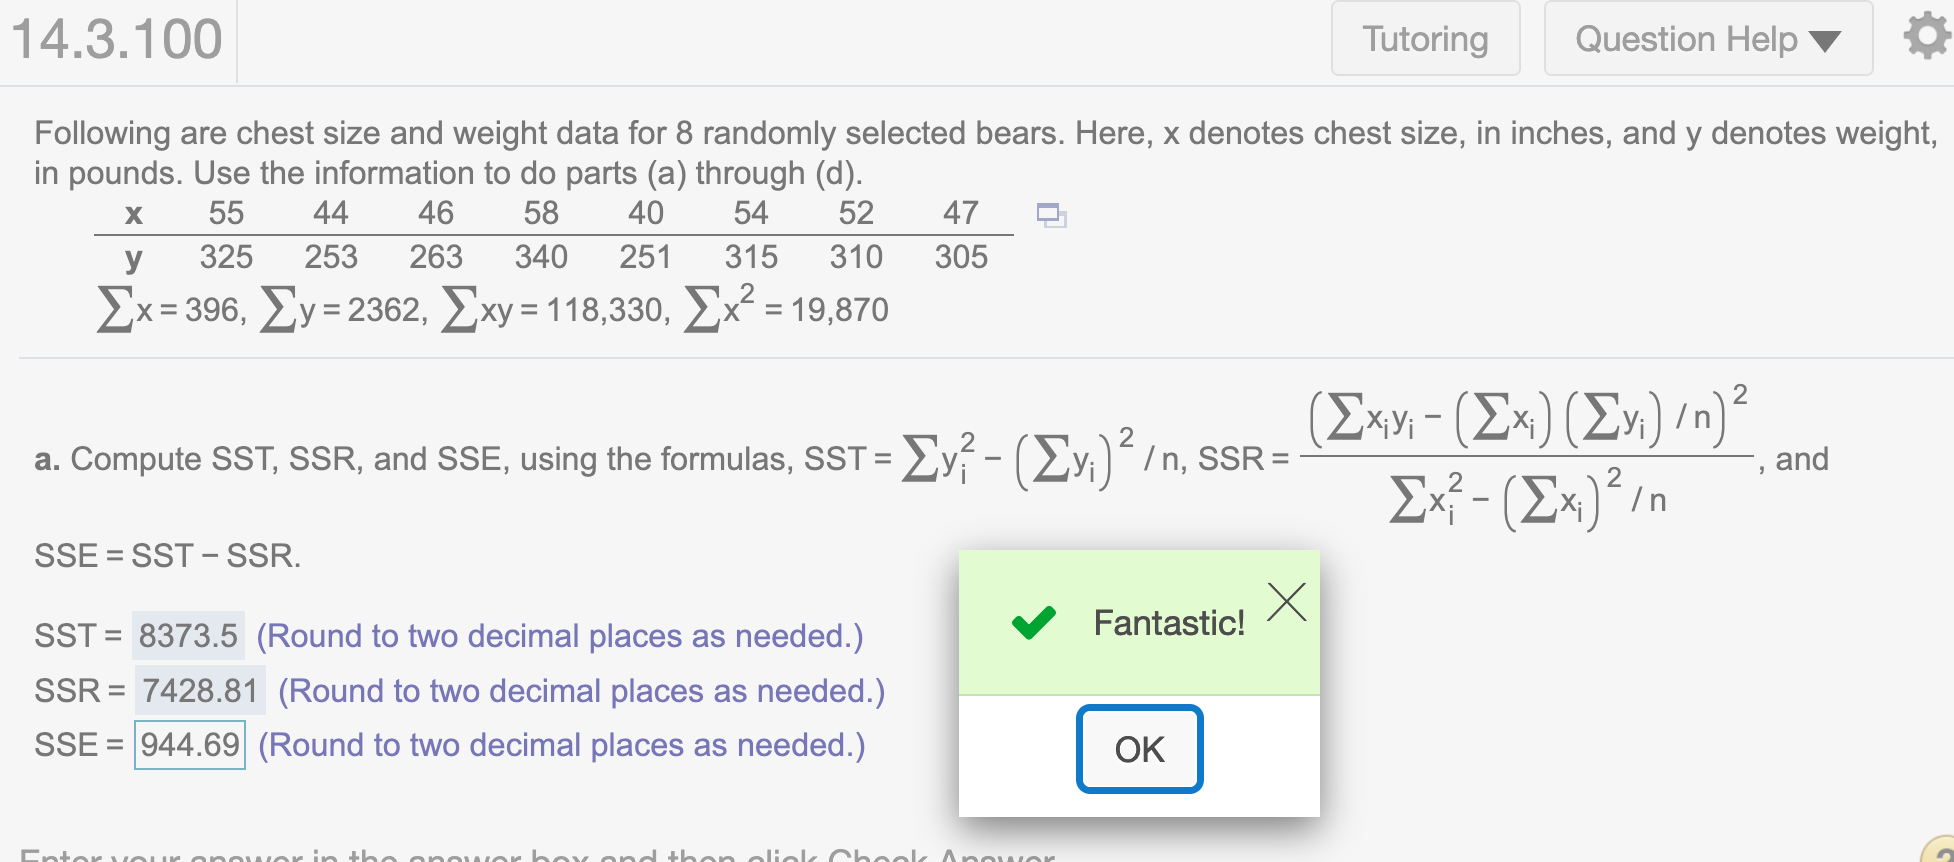
Check if SSE + SSR = SST
SSE + SSR == SST## [1] TRUESecond approach finding SST, SSR, SSE using \(\bar x, \bar y\)
Sxx = sum((x-mean(x))^2)
Sxy = sum((x-mean(x))*(y-mean(y)))
Syy = sum((y-mean(y))^2)Sxx## [1] 268Sxy## [1] 1411Syy## [1] 8373.5(b) Compute the coefficient of determination, \(r^2\)
First approach: using the formula
Linear correlation coefficient
r = Sxy/sqrt(Sxx*Syy)
r
## [1] 0.9419028Coefficient of determination \(r^2\)
r^2## [1] 0.887181Round to four decimal places
round(r^2, 4)## [1] 0.8872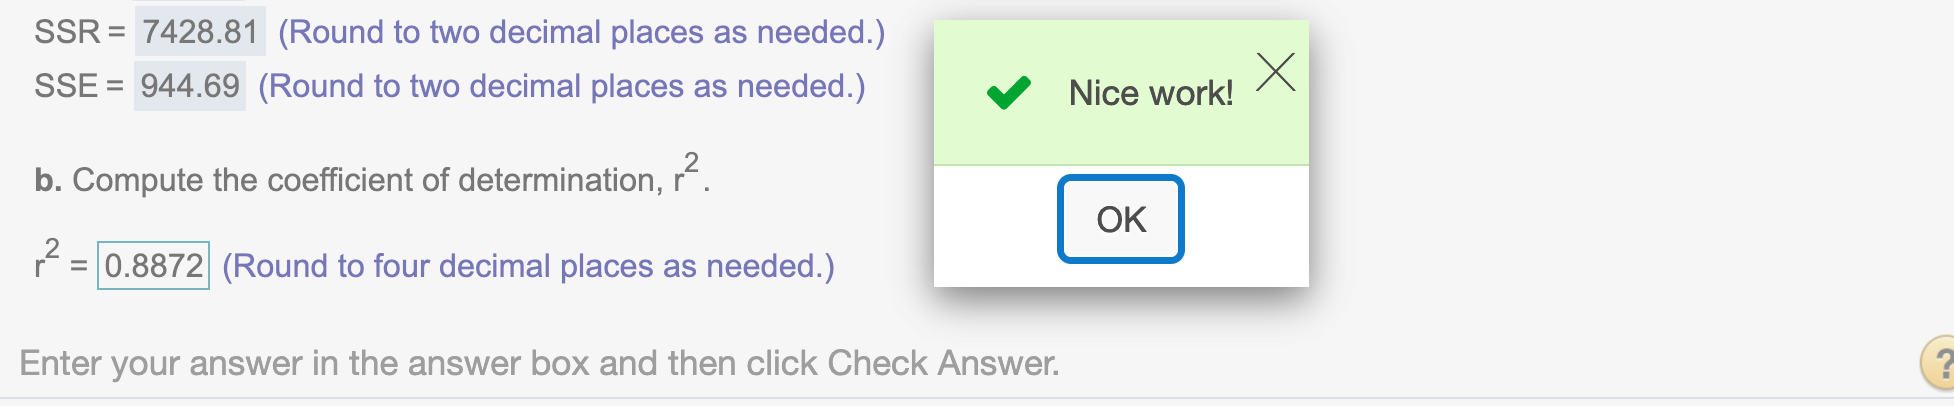
Second approach: using summary() in R
Multiple R-squared = coefficient of determination
summary(lm(y~x))##
## Call:
## lm(formula = y ~ x)
##
## Residuals:
## Min 1Q Median 3Q Max
## -13.8228 -6.2799 0.3955 2.6325 22.9123
##
## Coefficients:
## Estimate Std. Error t value Pr(>|t|)
## (Intercept) 34.6362 38.1993 0.907 0.399502
## x 5.2649 0.7665 6.869 0.000469 ***
## ---
## Signif. codes: 0 '***' 0.001 '**' 0.01 '*' 0.05 '.' 0.1 ' ' 1
##
## Residual standard error: 12.55 on 6 degrees of freedom
## Multiple R-squared: 0.8872, Adjusted R-squared: 0.8684
## F-statistic: 47.18 on 1 and 6 DF, p-value: 0.0004691Third approach: using cor() in R To find r, we run
cor(x,y)## [1] 0.9419028To find \(r^2\), we run
cor(x,y)^2## [1] 0.887181Round to 4 decimal places
round(cor(x,y)^2, 4)## [1] 0.8872(c) Determine the percentage of variation in the observed values of the response variable explained by the regression, and interpret your answer.
Show percentage value of \(r^2\)
round(cor(x,y)^2, 4) * 100## [1] 88.72
(d) State how useful the regression equation appears to be for making predictions. Choose the correct answer below.
Since the \(r^2\) value is close to 1, it is very useful to use regression equation
Hope that helps!