2.2.25 frequency distribution
A list of college wrestling champions for the years 1981dash
2005 is given in the table. Each college has been associated with a particular letter. Use this data to complete parts (a) through (d).
(a) Determine a frequency distribution.
First, we need to import the data from Excel. (For simplicity, this imports mannual by hand, we can get the same result by importing dataset from Excel)
data <- c("C", "B", "E", "B", "A", "B", "C", "A", "B", "C", "C", "B", "E", "C", "D", "B", "C", "A", "C", "A", "C", "B", "E", "A", "A")
data
## [1] "C" "B" "E" "B" "A" "B" "C" "A" "B" "C" "C" "B" "E" "C" "D" "B" "C" "A" "C"
## [20] "A" "C" "B" "E" "A" "A"We can get the frequency by using table() command
table(data)## data
## A B C D E
## 6 7 8 1 3To display frenquency table in column format use cbind() command
cbind(table(data))## [,1]
## A 6
## B 7
## C 8
## D 1
## E 3
(b) Obtain a relative-frequency distribution.
To display relative frenquency table in column format use cbind() command
cbind(table(data)/length(data))## [,1]
## A 0.24
## B 0.28
## C 0.32
## D 0.04
## E 0.12To display the result appropriate to 5 decimal places use print() command
In this case, we have nice results so it does not show the difference.
print(table(data)/length(data), 5)## data
## A B C D E
## 0.24 0.28 0.32 0.04 0.12
(c) Draw a pie chart. Choose the correct chart below.
Store relative-frequency table in a variable x
x <- table(data)/length(data)Display pie chart using pie() command
pie(x)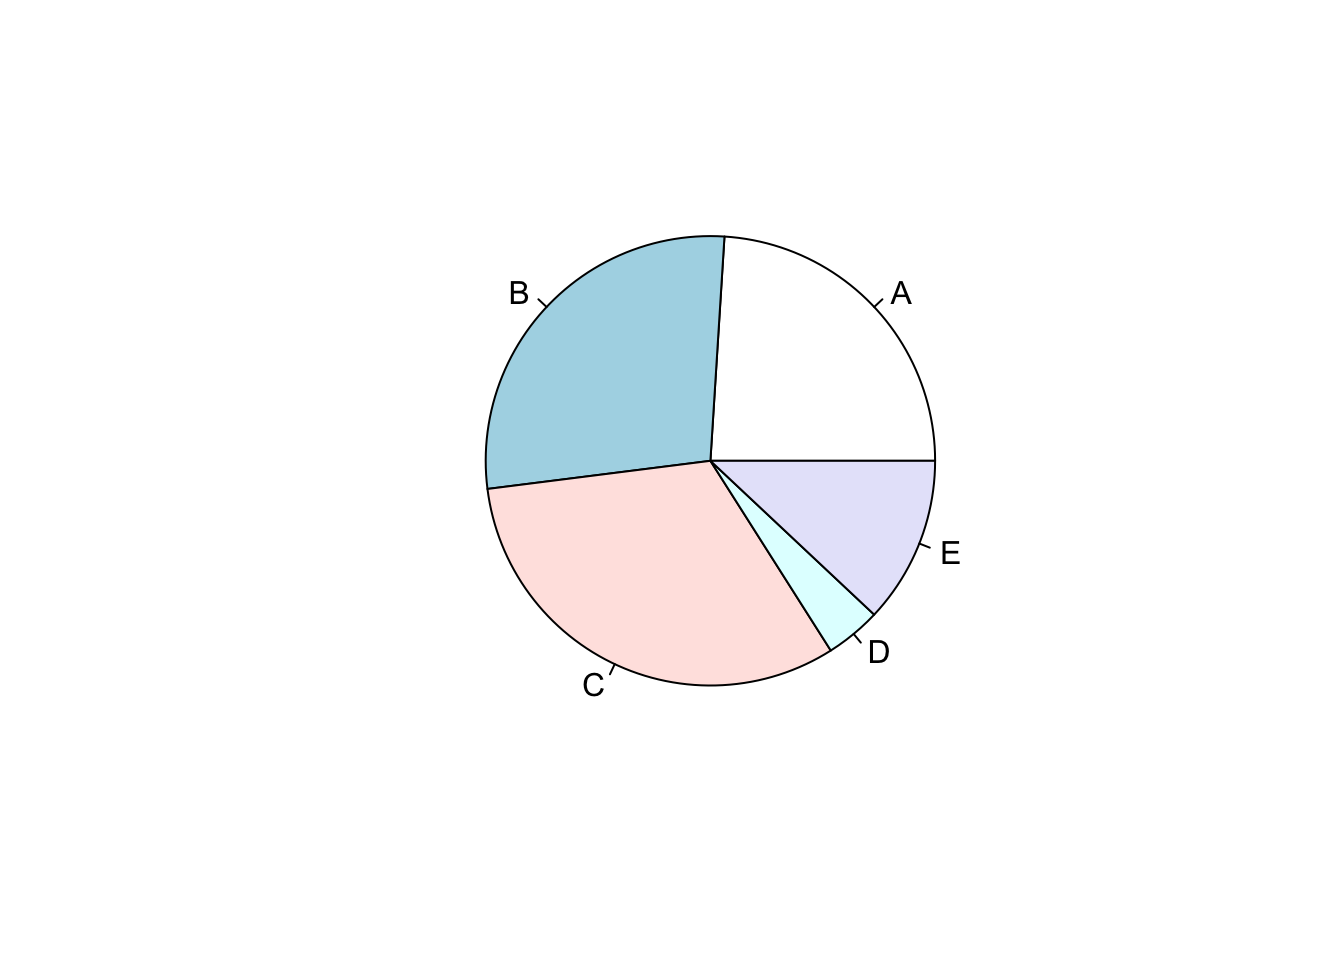
pie(x, labels = x)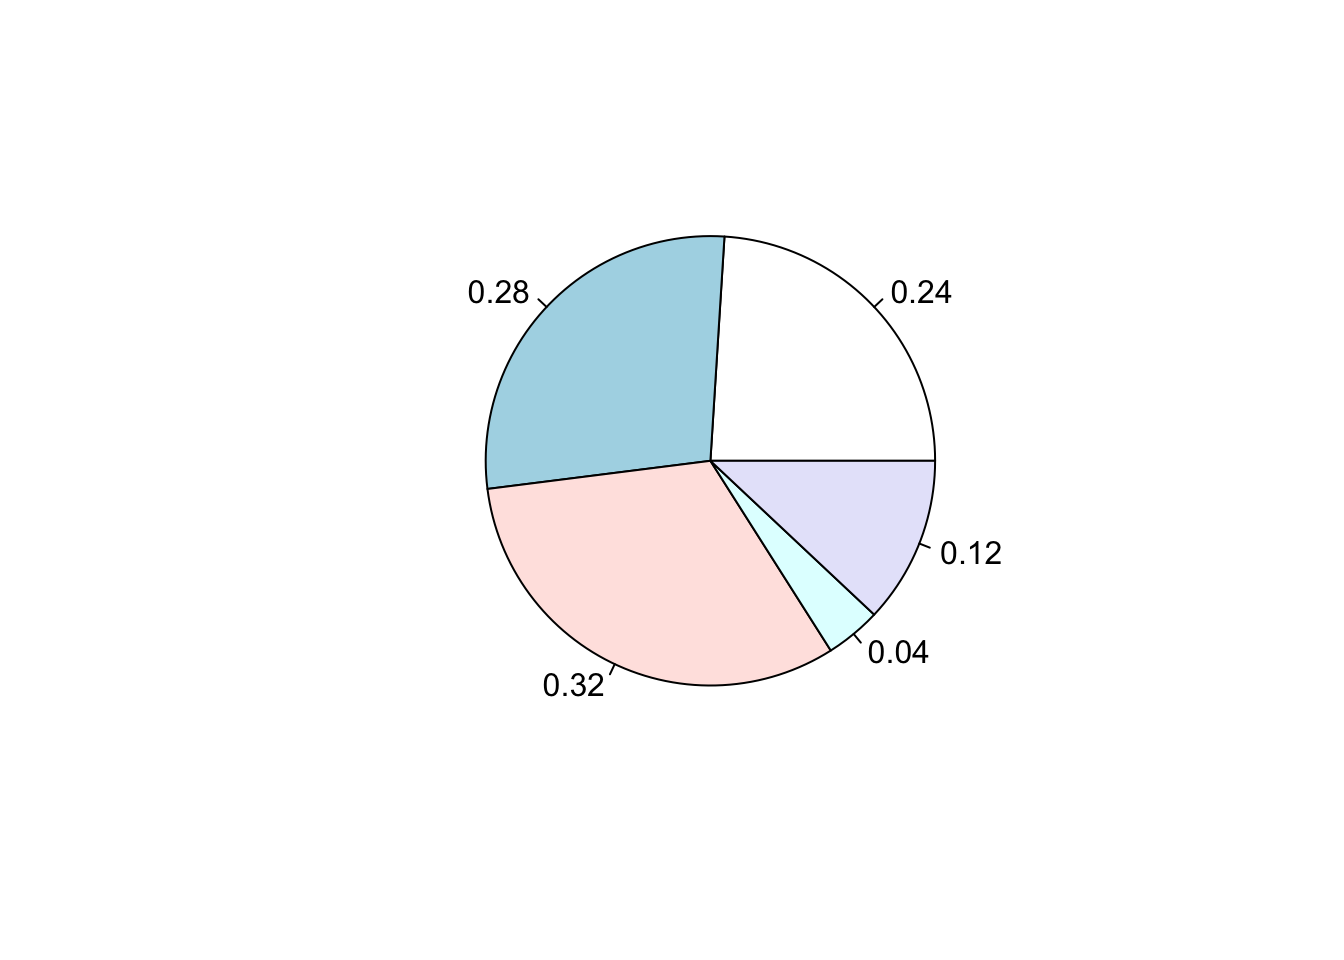

(d) Construct a bar chart. Choose the correct chart below.
Display bar chart using barplot() command
barplot(x)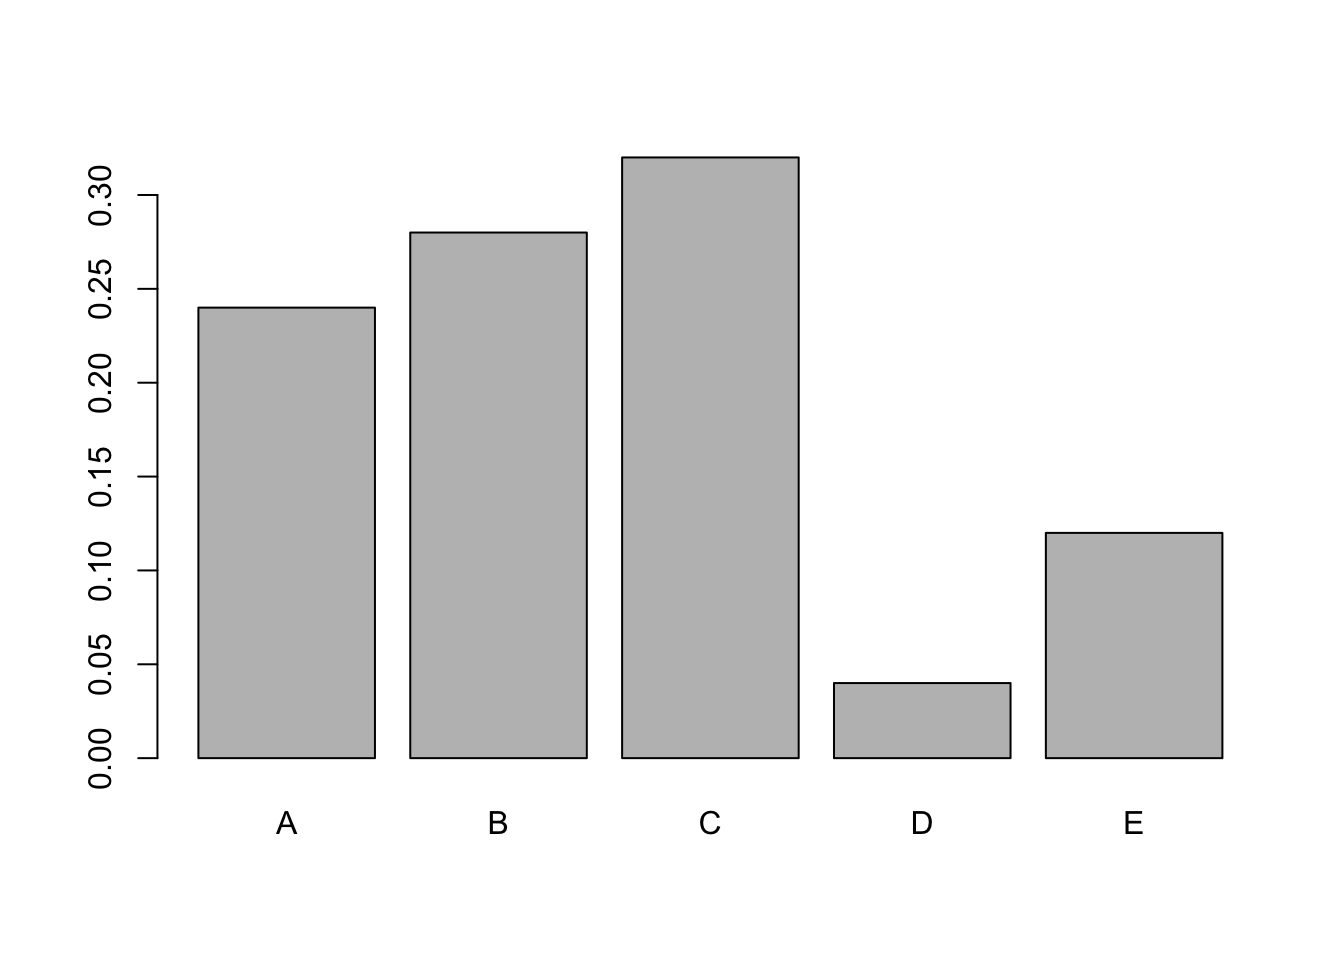

Hope that helps!