7.1.13 population and sample means
The data in the table represent the ages of the winners of an award for the past five years. Use the data to answer questions (a) through (e).
(Assume that sampling is without replacement.)
(a)Find the population mean age of the five winners.
First, we need to import the data from Excel. Illustrations shows importing data mannually
data <- c(37,42,49,49,43)We use mean() command to find the population mean
mean(data)## [1] 44
(b) For samples of size 3, construct a table of all possible samples and their sample means.
To construct the table of all possible samples of size 3, we use combn() command
combn(data,3)## [,1] [,2] [,3] [,4] [,5] [,6] [,7] [,8] [,9] [,10]
## [1,] 37 37 37 37 37 37 42 42 42 49
## [2,] 42 42 42 49 49 49 49 49 49 49
## [3,] 49 49 43 49 43 43 49 43 43 43To find sample mean, we run
x = combn(data, 3, mean)
x
## [1] 42.66667 42.66667 40.66667 45.00000 43.00000 43.00000 46.66667 44.66667
## [9] 44.66667 47.00000Round the answer to 2 decimal places
print(x, 4)## [1] 42.67 42.67 40.67 45.00 43.00 43.00 46.67 44.67 44.67 47.00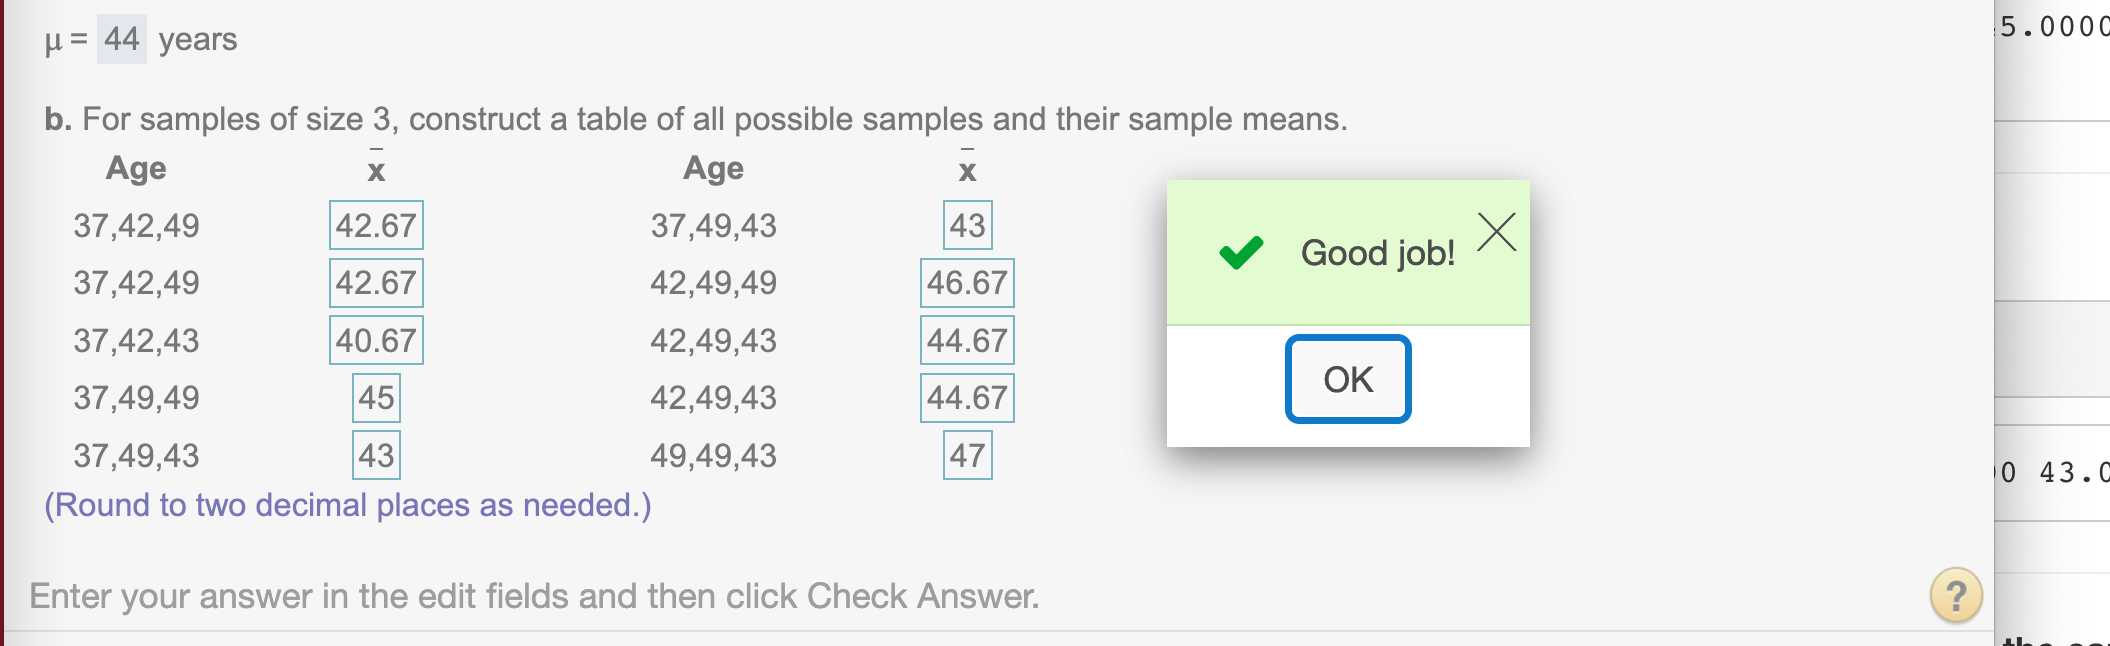
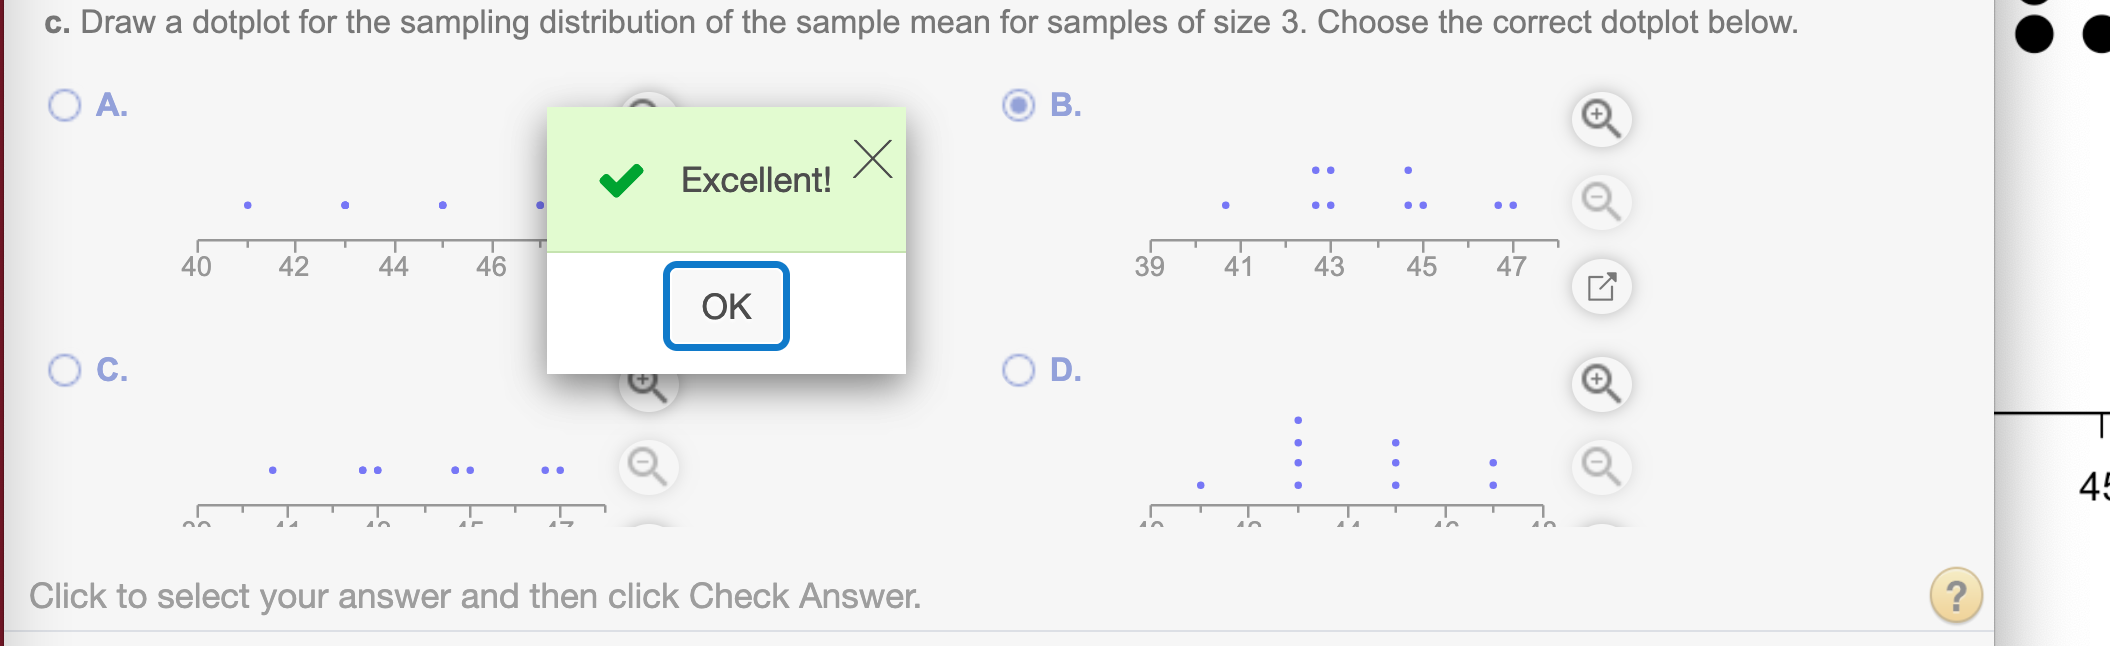
(c) Draw a dotplot for the sampling distribution of the sample mean for samples of size 3. Choose the correct dotplot below.
To draw a dotplot for sample mean, we use stripchart() command. method=“stack” shows the data on top of each other. pch=20 represents dark circle as a data. cex=3 indicates the size of circle.
stripchart(x, method="stack", pch=20, cex =3)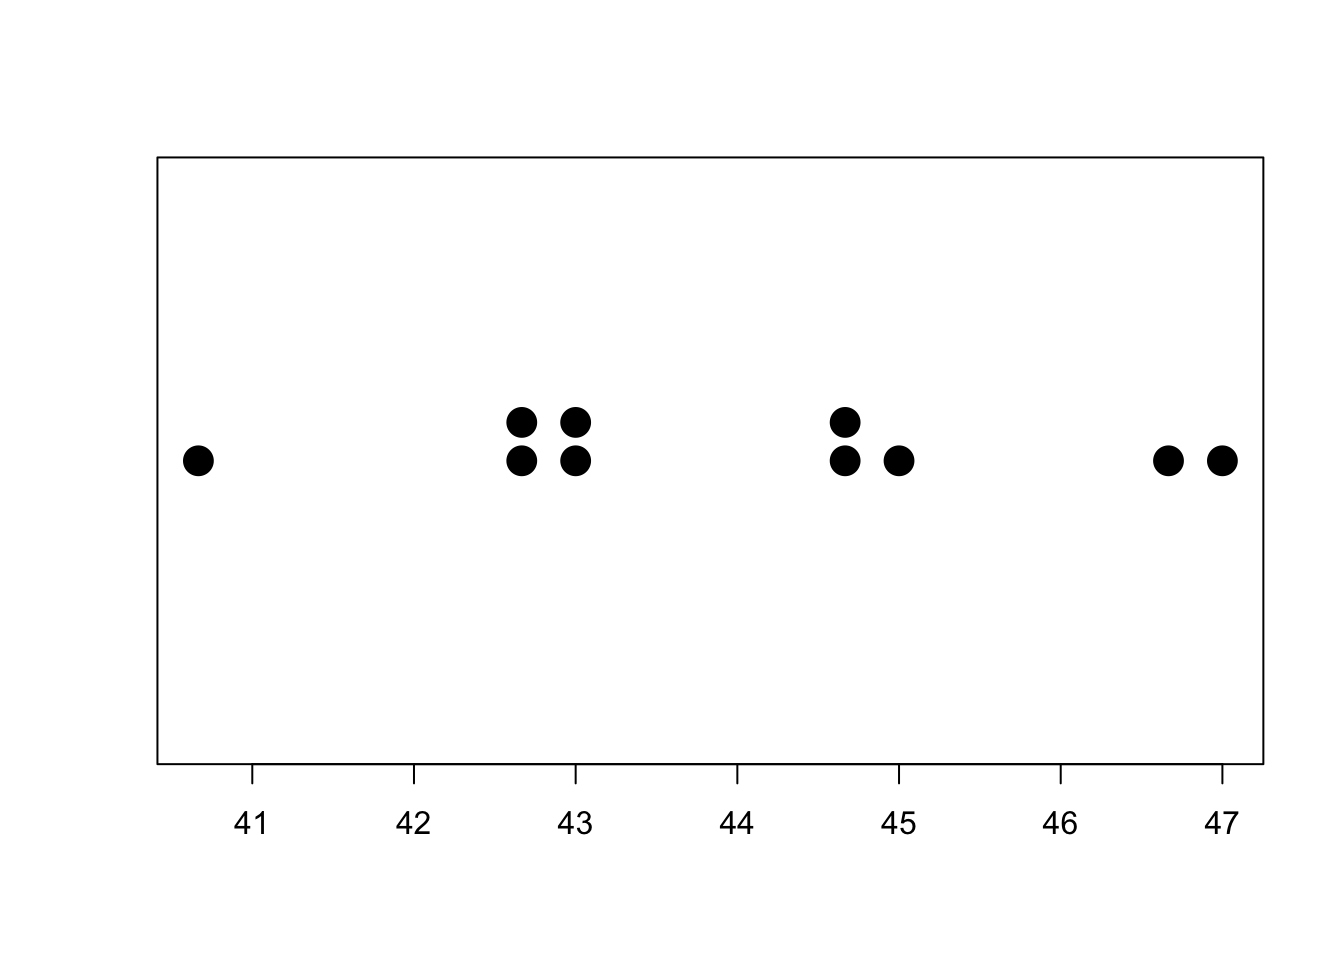
R provides dotchart() command which gives a chart slightly different from the one in Pearson. You could try it by running dotchart()
dotchart(as.numeric(x))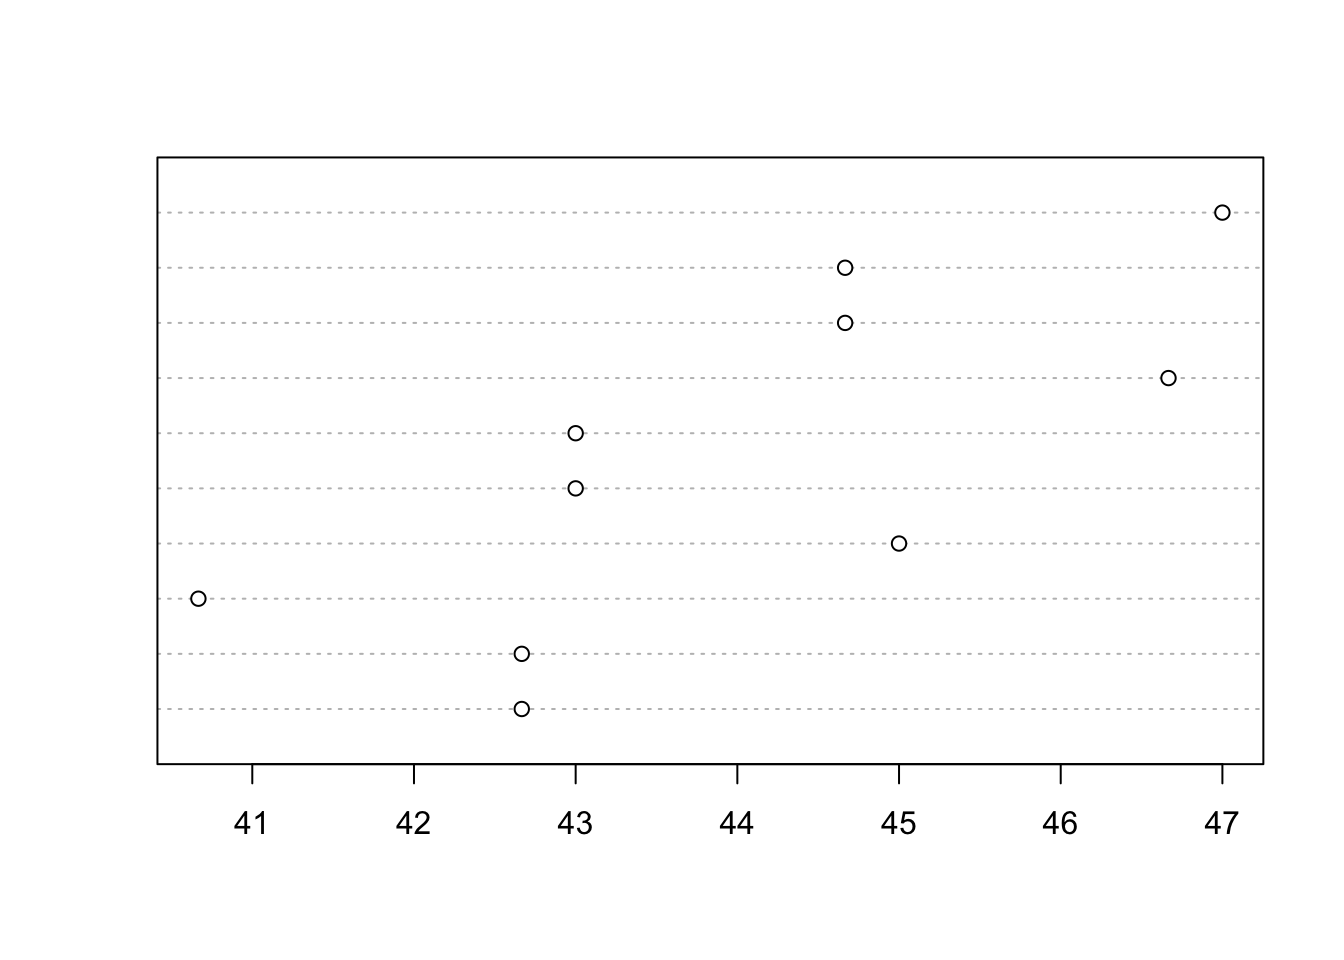
(d) For a random sample of size 3, what is the chance that the sample mean will equal the population mean?
Firstly, we need to round sample means to 2 decimal places
x = round(x,2)
x
## [1] 42.67 42.67 40.67 45.00 43.00 43.00 46.67 44.67 44.67 47.00We can use table() command to get the frequency table
table(x)## x
## 40.67 42.67 43 44.67 45 46.67 47
## 1 2 2 2 1 1 1We can check mannually z.if the mean is in the frequency table or we can run
table(x)[names(table(x)) == 44]## named integer(0)
(e) For a random sample of size 3, obtain the probability that the sampling error made in estimating the population mean by the sample mean will be 3 years or less; that is, determine the probability that x overbar will be within 3 years of mu.
To find the lower and upper bound, we run
44 - 3## [1] 4144 + 3## [1] 47We can use table() command to get the frequency table
table(x)## x
## 40.67 42.67 43 44.67 45 46.67 47
## 1 2 2 2 1 1 1Since the frequency between these range is 9, we can find the probability by running
9/length(x)## [1] 0.9
Hope that helps!