16.3.60 one-way ANOVA test
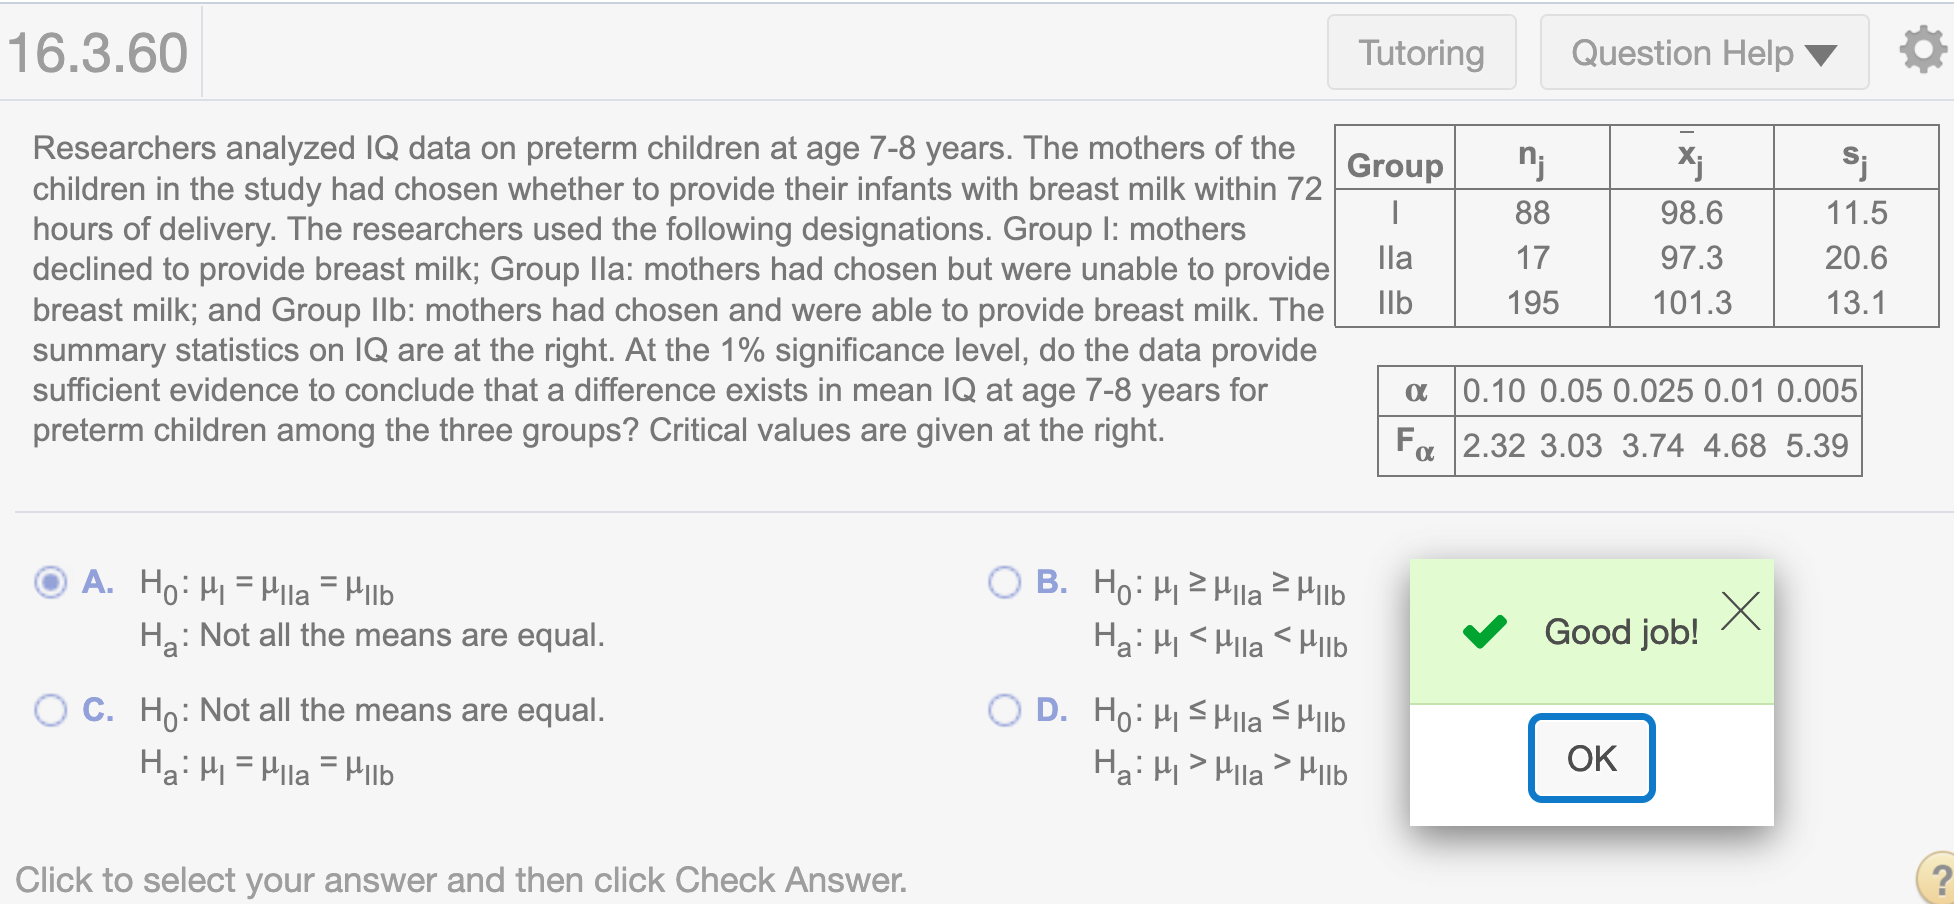
Researchers analyzed IQ data on preterm children at age 7-8 years. The mothers of the children in the study had chosen whether to provide their infants with breast milk within 72 hours of delivery. The researchers used the following designations. Group I: mothers declined to provide breast milk; Group IIa: mothers had chosen but were unable to provide breast milk; and Group IIb: mothers had chosen and were able to provide breast milk. The summary statistics on IQ are at the right. At the 1% significance level, do the data provide sufficient evidence to conclude that a difference exists in mean IQ at age 7-8 years for preterm children among the three groups? Critical values are given at the right.
Notation in one-way ANOVA:
k = number of populations
n = total number of observations
\(\bar x\) = mean of all n observations
\(n_j\) = size of sample from Population j
\(\bar{x_j}\) = mean of sample from Population j
\(s_j^2\) = variance of sample from Population j
\(T_j\) = sum of sample data from Population j
Defining formulas from sums of squares in one-way ANOVA:
SST = \(\sum (x_i - \bar x)^2\)
SSTR = \(\sum n_j(\bar{x_j} - \bar{x})^2\)
SSE = \(\sum (n_j-1)s_j^2\)
One-way ANOVA identity: SST = SSTR + SSE
Computing formulas from sums of squares in one-way ANOVA:
SST = \(\sum x_i^2 - (\sum x_i)^2/n\)
SSTR = \(\sum (T_j^2/n_j) - (\sum x_i)^2/n\)
SSE = SST - SSTR
Mean squares in one-way ANOVA:
MSTR = \(\frac{SSTR}{k-1}\)
MSE = \(\frac{SSE}{n-k}\)
SSE = SST - SSTR
Test statistic for one-way ANOVAA (independent samples, normal populations, and equal population standard deviations):
- F = \(\frac{MSTR}{MSE}\)
with df = (k - 1, n - k)
Confidence interval for \(\mu_i - \mu_j\) in the Tukey multiple-comparison method (independent samples, normal populations, and equal population sstandard deviations):
- \((\bar{x_i} - \bar{x_j}) \pm \frac{q_{\alpha}}{\sqrt{2}}.s\sqrt{\frac{1}{n_i} + \frac{1}{n_j}}\)
where s = \(\sqrt{MSE}\) and \(q_{\alpha}\) is obtained for a q-curve with parameters k and n - k
Test statistic for a Kruskal-Wallis test (independent samples, same-shape populations, all sample sizes 5 or greater):
\(K=\frac{SSTR}{SST/(n-1)}\) or
\(K=\frac{12}{n(n+1)}\sum_{j=1}^{k} \frac{R_j^2}{n_j} - 3(n+1)\)
where SSTR and SST are computed for the ranks of the data, and \(R_j\) denotes the sum of the ranks for the sample data from Population j. K has approximately a chi-square distribution with df = k -1
(a) Find the null and alternative hypotheses. Choose the correct answer below.
Since the question asks that “a difference exists in mean IQ at age 7-8 years for preterm children among the three groups,” the correct hypothesis is.
\(H_0: \mu_I = \mu_{IIa} = \mu_{IIb}\)
\(H_a:\) Not all the means are equal.
First we need to get the data from the question.
nj <- c(88, 17, 195)
x <- c(98.6, 97.3, 101.3)
s <- c(11.5, 20.6, 13.1)
Names of variables
n = total number of observations: n
We find SSTR, SSE, SST by using defining formula
n = sum(nj)
k = length(x)
Find SSTR using the formula SSTR = \(\sum n_j(\bar{x_j} - \bar{x})^2\)
SSTR = sum(nj*(x- sum(nj*x)/sum(nj))^2)
SSTR
## [1] 602.2155round(SSTR, 2)## [1] 602.22Find SSE using the formula SSE = \(\sum (n_j-1)s_j^2\)
SSE = sum((nj-1)*s^2)
SSE
## [1] 51587.85round(SSE, 2)## [1] 51587.85Find SST, we use formula SST = SSE + SSTR
SST = SSE + SSTR
SST
## [1] 52190.07round(SST, 2)## [1] 52190.07Find df treatment
k = length(x)
k-1
## [1] 2Find SS treatment
SSTR## [1] 602.2155Find MS treatment
MSTR = SSTR/(k-1)
MSTR
## [1] 301.1077Find Error df
n - k## [1] 297Find Error SS
SSE## [1] 51587.85Find Error MS
MSE = SSE / (n - k)
MSE
## [1] 173.6965Find F-statistic treatment
MSTR / MSE## [1] 1.733528round(MSTR / MSE, 2)## [1] 1.73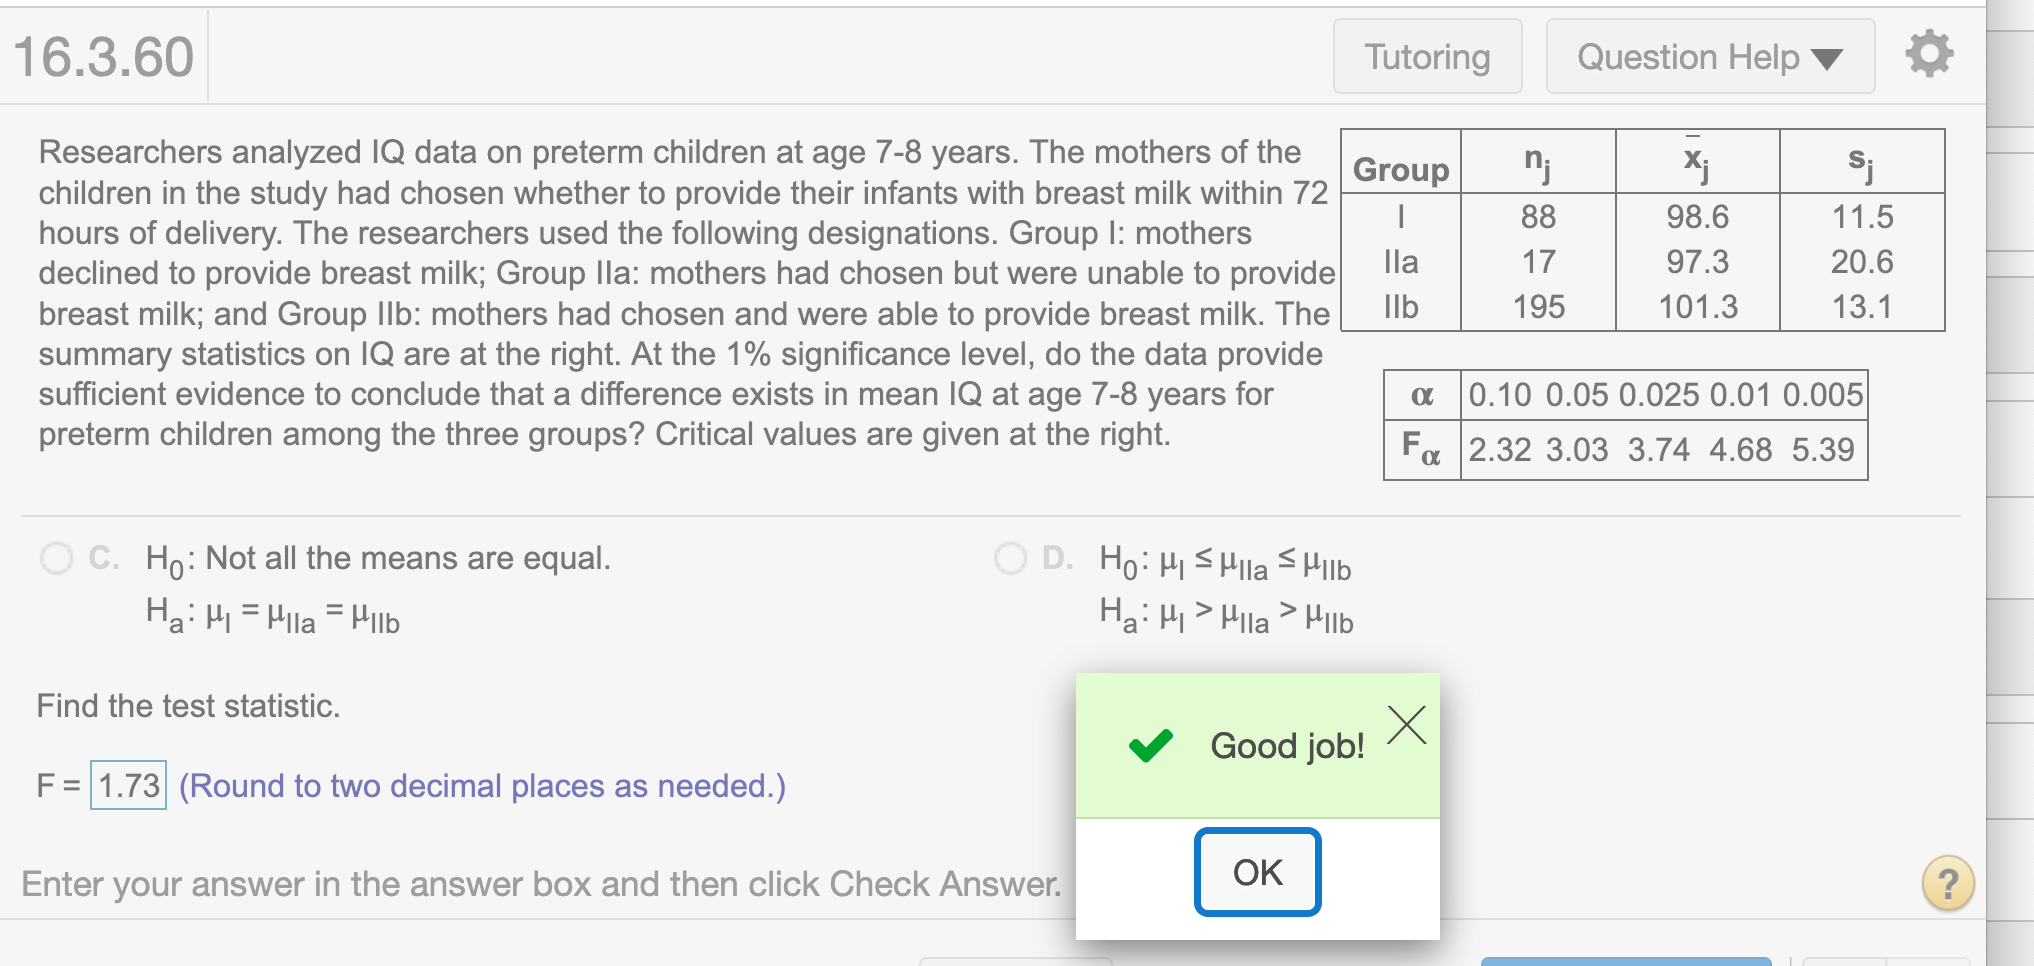
Find df total
n - 1## [1] 299Find SS total
SST## [1] 52190.07Find the critical value.
Since \(\alpha = .01\)
alpha = 0.01
qf(1-alpha, k-1, n-k)
## [1] 4.67732Round to decimal places
round(qf(1-alpha, k-1, n-k), 2)## [1] 4.68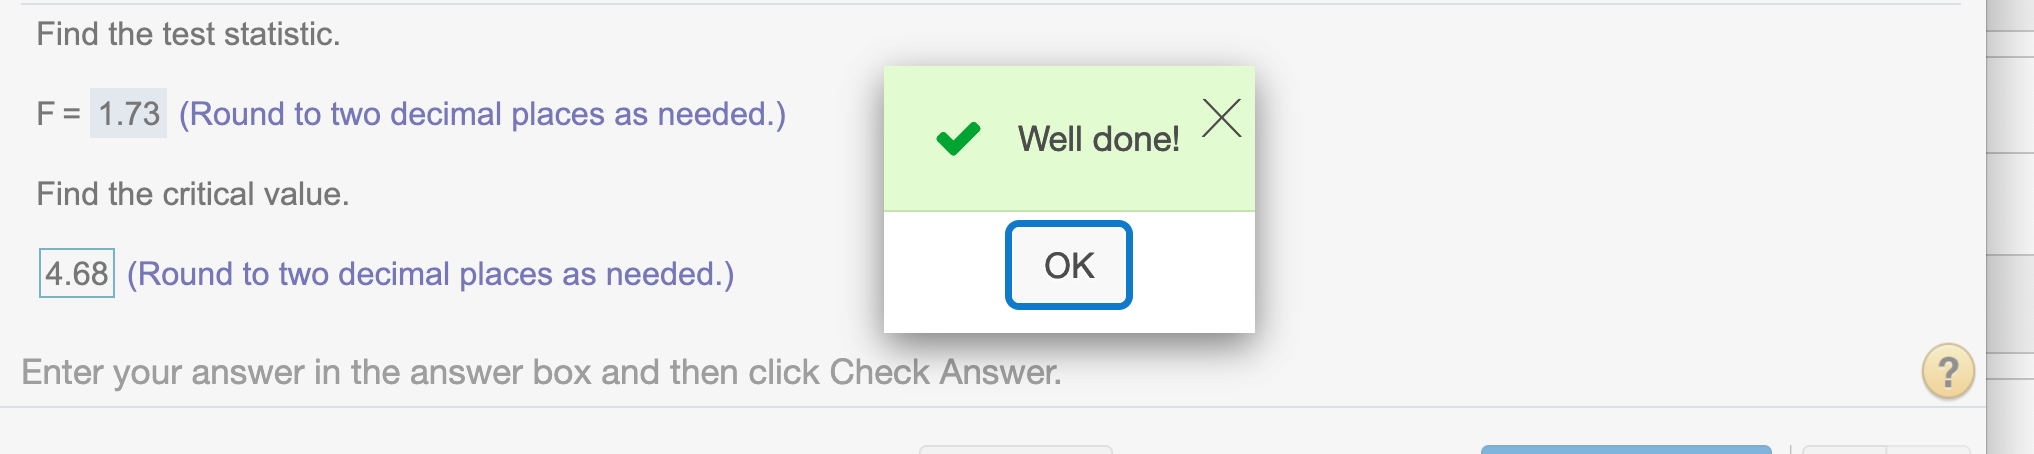
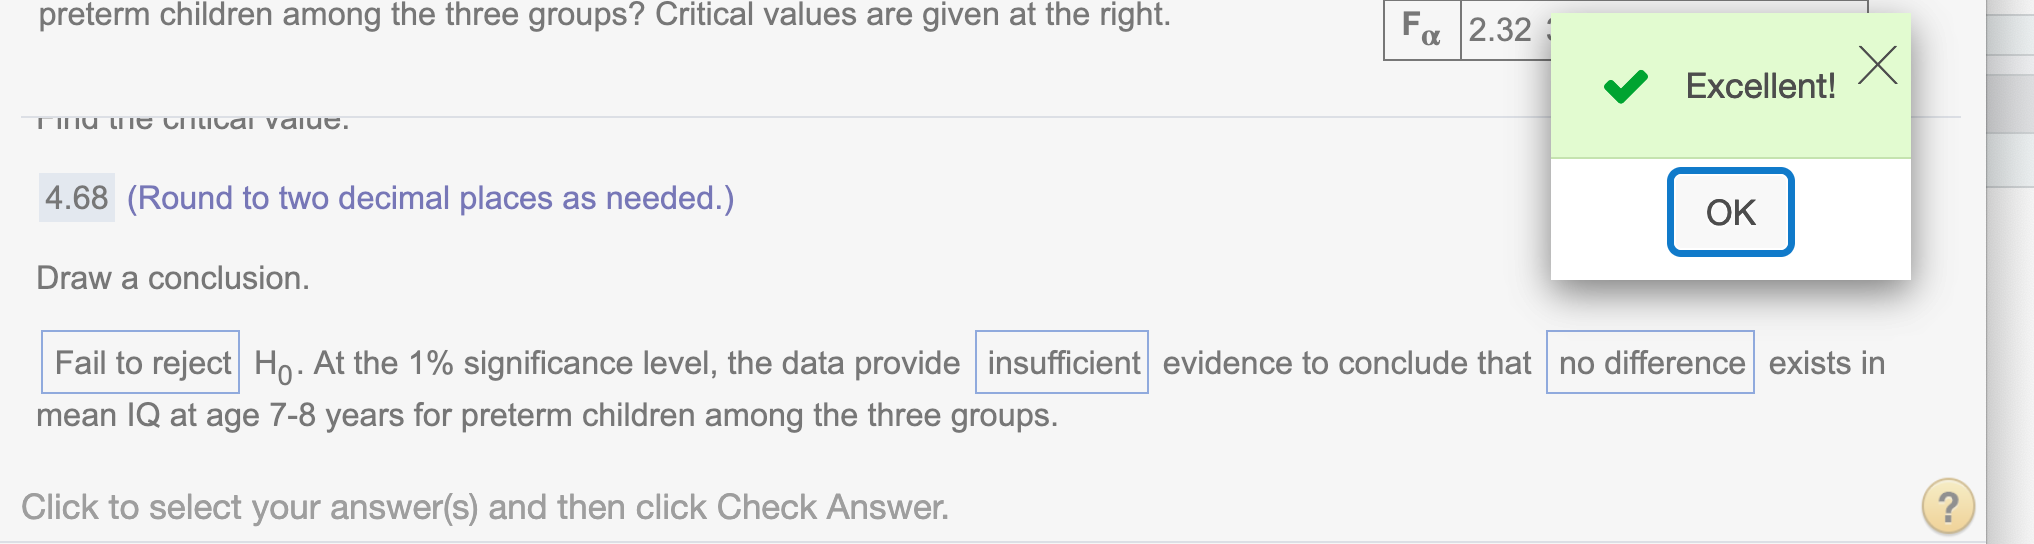
Since our test statistic = 1.73 < our critical value \(F_{\alpha}\)=4.68 and it is a right-tailed test, we do not have enough evidence to reject the hypothesis.
Hope that helps!