10.2.51 pooled t-test with data
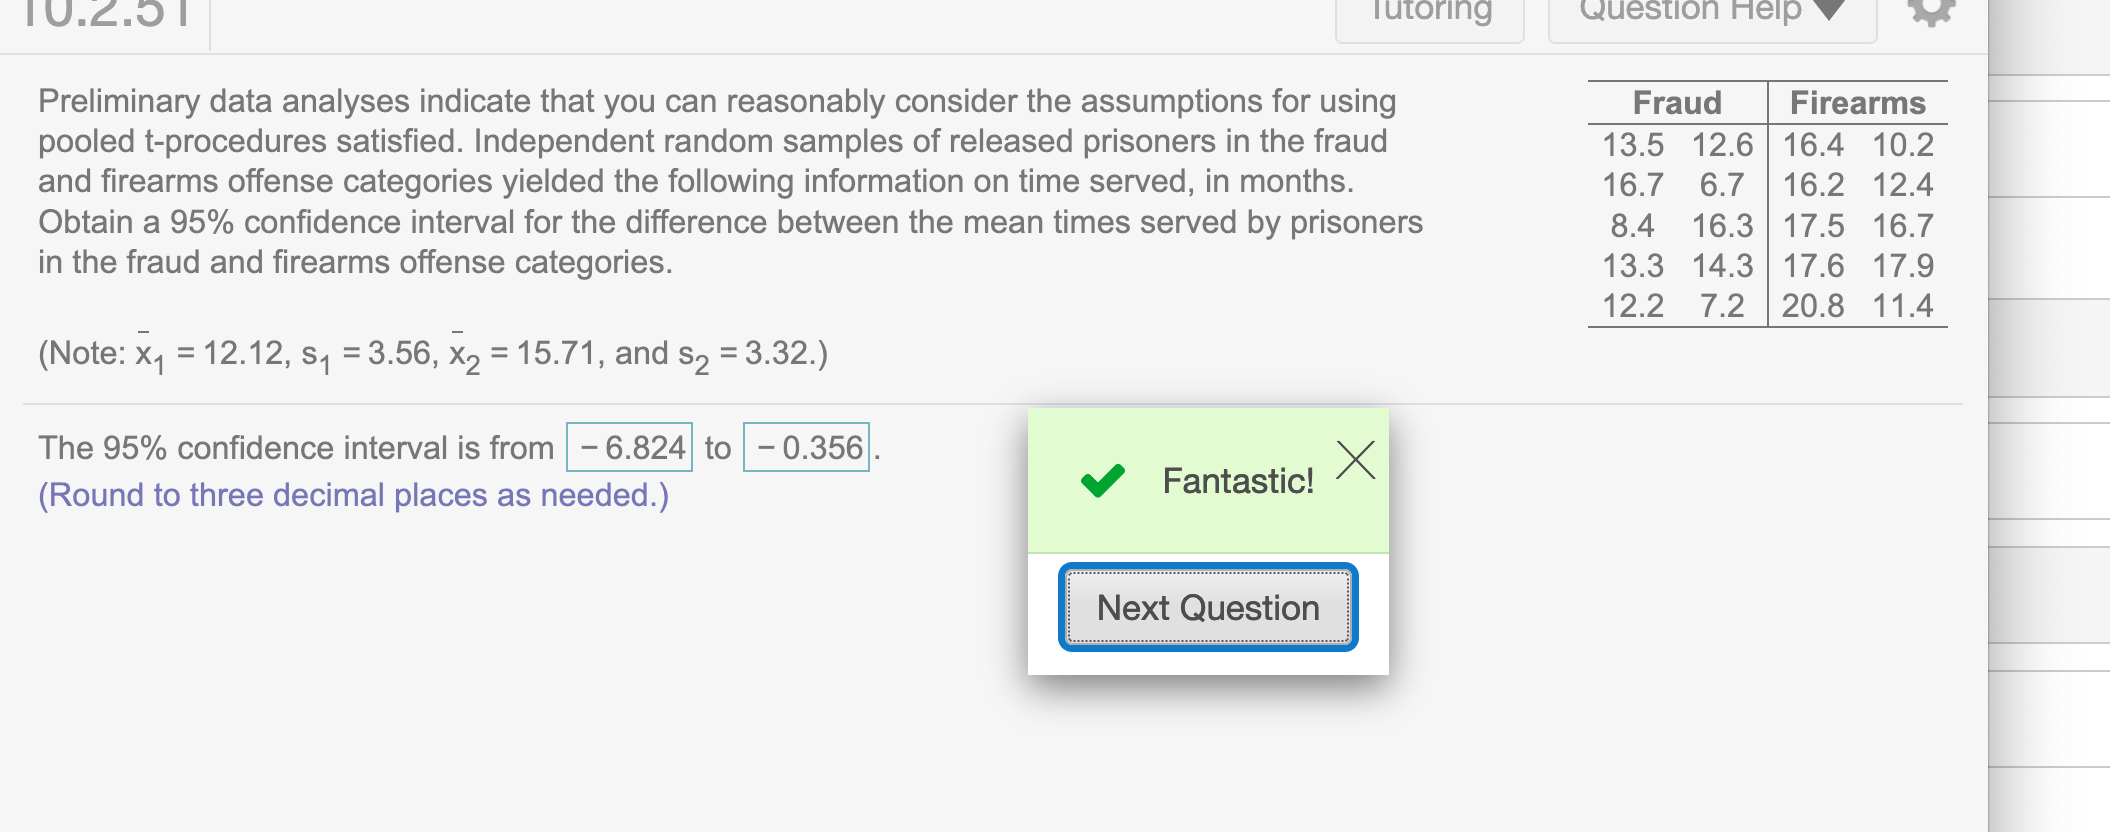
Preliminary data analyses indicate that you can reasonably consider the assumptions for using pooled t-procedures satisfied. Independent random samples of released prisoners in the fraud and firearms offense categories yielded the following information on time served, in months. Obtain a 95 %
confidence interval for the difference between the mean times served by prisoners in the fraud and firearms offense categories.
(Note: \(\bar x_1=12.12, s_1=3.56, \bar x_2=15.71, s_2=3.32\))
The 95% confidence interval is from … to …
First, we need to get the data from the question
fraud <- c(13.5, 12.6, 16.7, 6.7, 8.4, 16.3, 13.3, 14.3, 12.2, 7.2)
firearms <- c(16.4, 10.2, 16.2, 12.4, 17.5, 16.7, 17.6, 17.9, 20.8, 11.4)
The note means that these data are optional to know. In the case that the question does not provide these data, we could find sample mean, sample standard deviation, and size by running
Round to two decimal places
round(mean(fraud), 2)## [1] 12.12round(sd(fraud), 2)## [1] 3.56length(fraud)## [1] 10round(mean(firearms), 2)## [1] 15.71round(sd(firearms),2)## [1] 3.32length(firearms)## [1] 10We have the same data set with the note from the question, we could use the same approach in question 10.2.41 to find confidence interval
or we could use t.test() function in R to find confidence interval
Since this is a pooled t-test, we specify var.equal = TRUE
t.test(fraud, firearms, conf.level=.95, var.equal = TRUE)##
## Two Sample t-test
##
## data: fraud and firearms
## t = -2.3324, df = 18, p-value = 0.03149
## alternative hypothesis: true difference in means is not equal to 0
## 95 percent confidence interval:
## -6.8237597 -0.3562403
## sample estimates:
## mean of x mean of y
## 12.12 15.71To have 3 decimal places, we can use print() command
print(t.test(fraud, firearms, conf.level=.95, var.equal = TRUE), 3)##
## Two Sample t-test
##
## data: fraud and firearms
## t = -2, df = 18, p-value = 0.03
## alternative hypothesis: true difference in means is not equal to 0
## 95 percent confidence interval:
## -6.824 -0.356
## sample estimates:
## mean of x mean of y
## 12.1 15.7To illustate that we will have the same answer when we use the same approach in question 10.2.41
First, we need to get the data from the question
x1 = 12.12
s1 = 3.56
n1 = 10
x2 = 15.71
s2 = 3.32
n2 = 10
This is a pooled t-test, to compute pooled sample standard deviation we use the formula \(s_p= \frac{(n_1-1)s_1^2+(n_2-1)s_2^2}{n_1+n_2-2}\)
sp = sqrt( ( (n1-1)*s1^2 + (n2-1)*s2^2 )/ (n1+n2-2) )
sp
## [1] 3.442092We need to find degree of freedom
deg = n1+n2-2Since the confidence level = 0.95, \(\alpha = 1-.95=.05\)To find \(t_{\alpha/2}\) we run
alpha = .05
t_alpha2 = abs(qt(alpha/2,deg))
t_alpha2
## [1] 2.100922
The 95% confidence interval is from… to…(Round to three decimal places as needed.)
To find confidence interval we use the formular \((\bar x_1 - \bar x_2) \pm t_{\alpha/2}.s_p\sqrt{1/n_1+1/n_2}\)
(x1-x2) - t_alpha2*sp*sqrt(1/n1+1/n2)## [1] -6.824055(x1-x2) + t_alpha2*sp*sqrt(1/n1+1/n2)## [1] -0.3559446Round to three decimal places
round((x1-x2) - t_alpha2*sp*sqrt(1/n1+1/n2),3)## [1] -6.824round((x1-x2) + t_alpha2*sp*sqrt(1/n1+1/n2),3)## [1] -0.356We finish a lot of complicated work by using R
Hope that helps!