3.4.171 quartiles
An article by a researcher reported on a long-term study of the effects of hurricanes on tropical streams in forests. The study shows that one particular hurricane had a significant impact on stream water chemistry. The following table shows a sample of 10 ammonia fluxes in the first year after the hurricane. Data are in kilograms per hectare per year. Complete parts (a) through (e) below.Recommanded find quatiles mannually in Excel since there is inconsistent approach in R
- even number of data set - type 5
- odd number of data set - type 1
First, we need to import the data from Excel. (For simplicity, this imports mannual by hand, we can get the same result by importing dataset from Excel)
x <- c(88, 171, 64, 159, 89, 84, 180, 126, 123, 91)
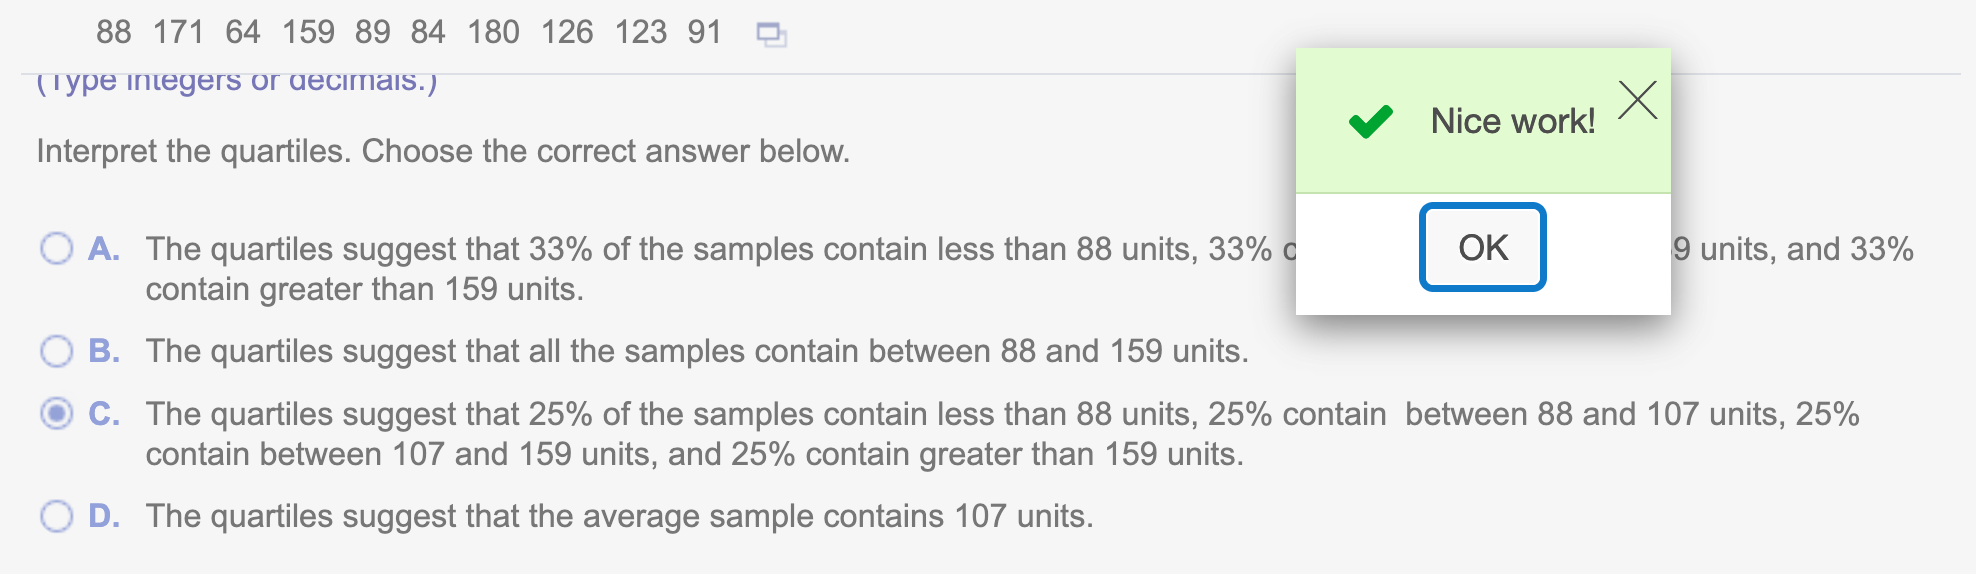
x## [1] 88 171 64 159 89 84 180 126 123 91(a). Obtain and interpret the quartiles
Since we have even number of
summary(x, quantile.type=5)## Min. 1st Qu. Median Mean 3rd Qu. Max.
## 64.0 88.0 107.0 117.5 159.0 180.0quantile(x, type=5)## 0% 25% 50% 75% 100%
## 64 88 107 159 180
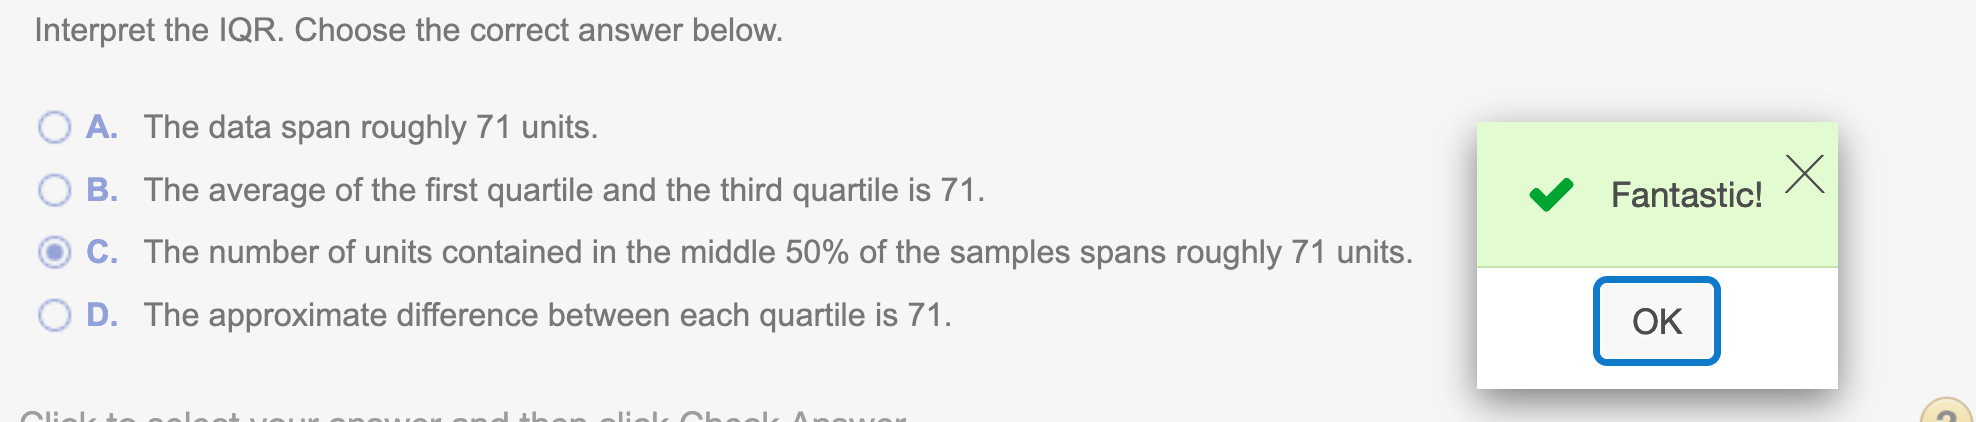
(b).Determine and interpret the interquartile range (IQR). We use the formula $IQR = Q_3-Q_1 $
159-88## [1] 71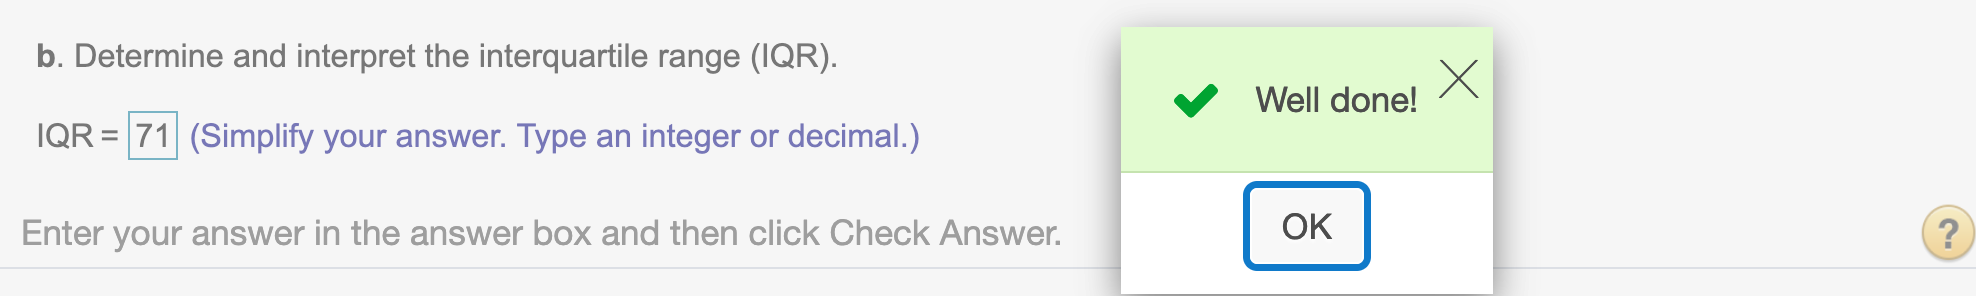
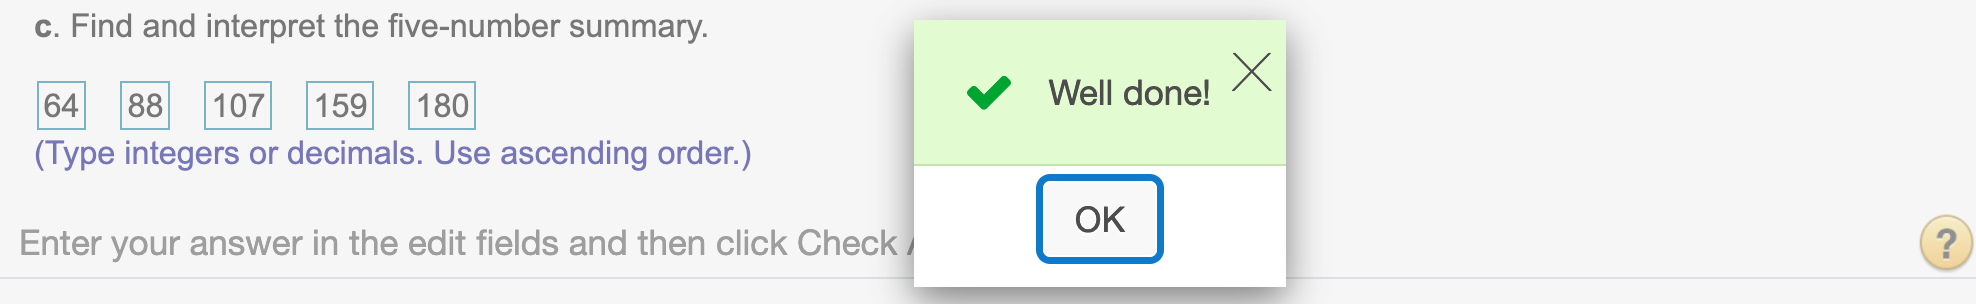
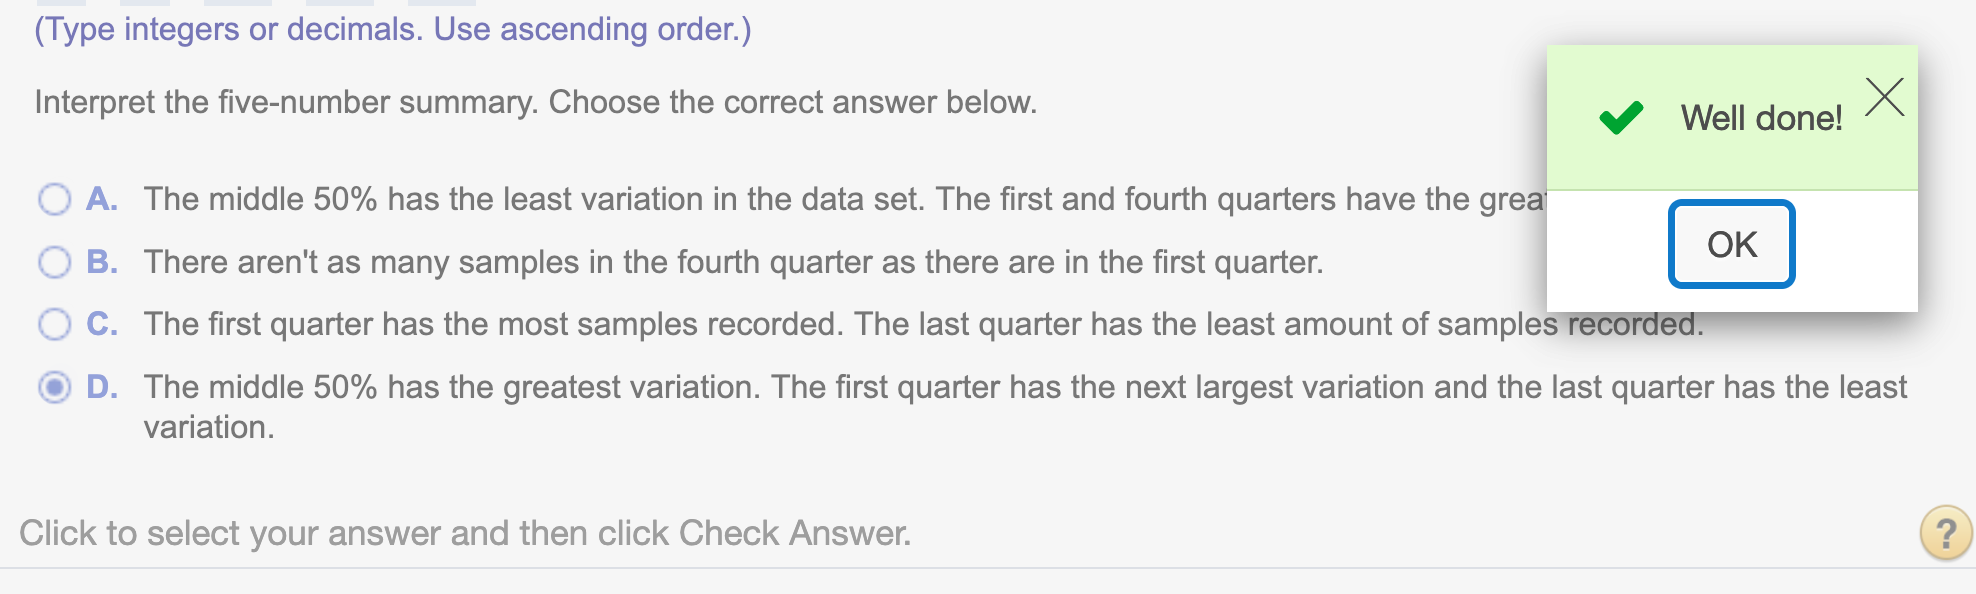
(c). Find and interpret the five-number summary.
We can see the summary from part (a)
To interpret five-number summary, we plot boxplot of data
boxplot(quantile(x, type=5))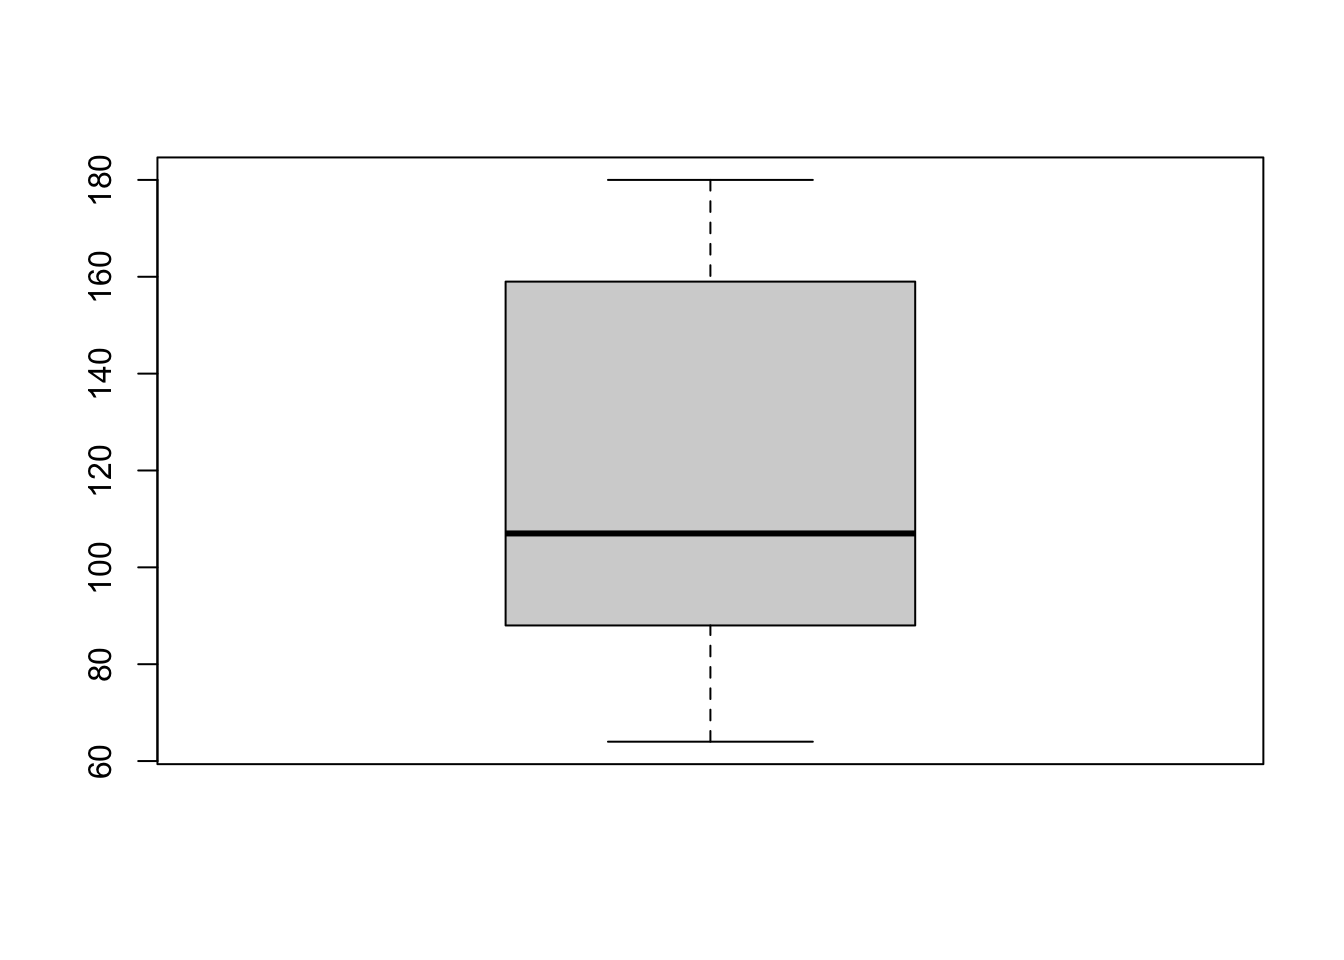
(d). Identify potential outliers, if any. Choose the correct answer below and, if necessary, fill in the answer box to complete your choice
- Lower limit = \(Q_1 - 1.5.IQR\)
- Upper limit = \(Q_3 + 1.5.IQR\)
Lower limit
88 - 1.5 * 71## [1] -18.5Upper limit
159 + 1.5 * 71## [1] 265.5Sort our data
sort(x)## [1] 64 84 88 89 91 123 126 159 171 180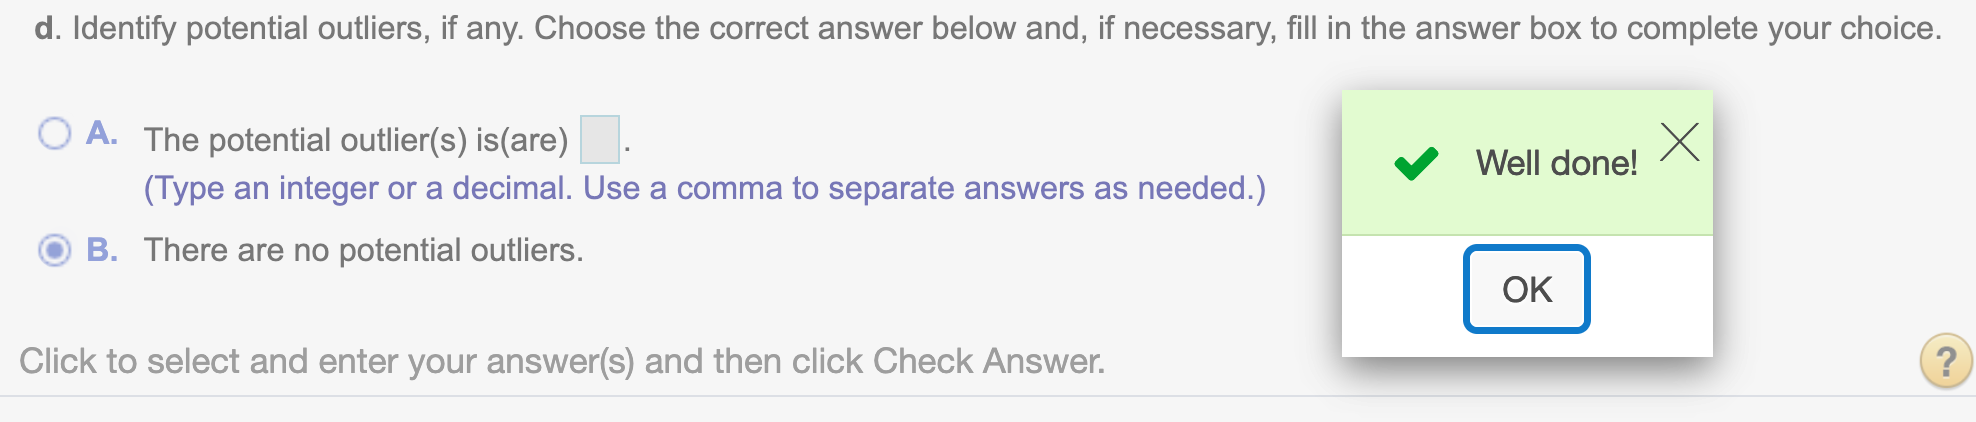
Hope that helps!