9.4.85 left-tailed z-test with data
The recommended dietary allowance (RDA) of iron for adult females is 18 milligrams (mg) per day. The given iron intakes (mg) were obtained for 45 random adult females. At the 10% significance level, do the data suggest that adult females are, on average, getting less than the RDA of 18 mg of iron? Assume that the population standard deviation is 4.6mg. Preliminary data analyses indicate that applying the z-test is reasonable. (Note: \(\bar x\) =14.66 )
The test statistic is z =
First, we need to import data from Excel. (Here we get the data mannually)
data = c(14.9, 17.5, 14.7, 14.7, 10.6, 18.5, 18.1, 18.8, 15.4, 16, 12.6, 16.3, 21.1, 19.1, 11.6, 12.5, 15.1, 11, 15.3, 9.5, 18.8, 17.8, 13.9, 16.3, 11.6, 15.9, 12.6, 14.5, 11.4, 13, 18.5, 13, 11.7, 10.8, 17.7, 12, 17.7, 6.4, 16.9, 12.6, 16.5, 14.7, 13.2, 16.8, 12)The question provides sample mean \(\bar x\) =14.66. Since we have the data, we could check it by running mean() command
mean(data)## [1] 14.65778round(mean(data), 2)## [1] 14.66The given iron intakes (mg) were obtained for 45 random adult females. So the sample size is 45. We can get it by using length() command
length(data)## [1] 45Assume that the population standard deviation is 4.6 mg.
Since the question assumes that we know the population standard deviation and the sample size is greater 30. We can run z-test.
If the population standard deviation is unknown and the sample size is small, t-test is prefered.
At the 10 % significance level, do the data suggest that adult females are, on average, getting less than the RDA of 18 mg of iron \(H_0: \mu = 18 mg\) \(H_a: \mu < 18 mg\)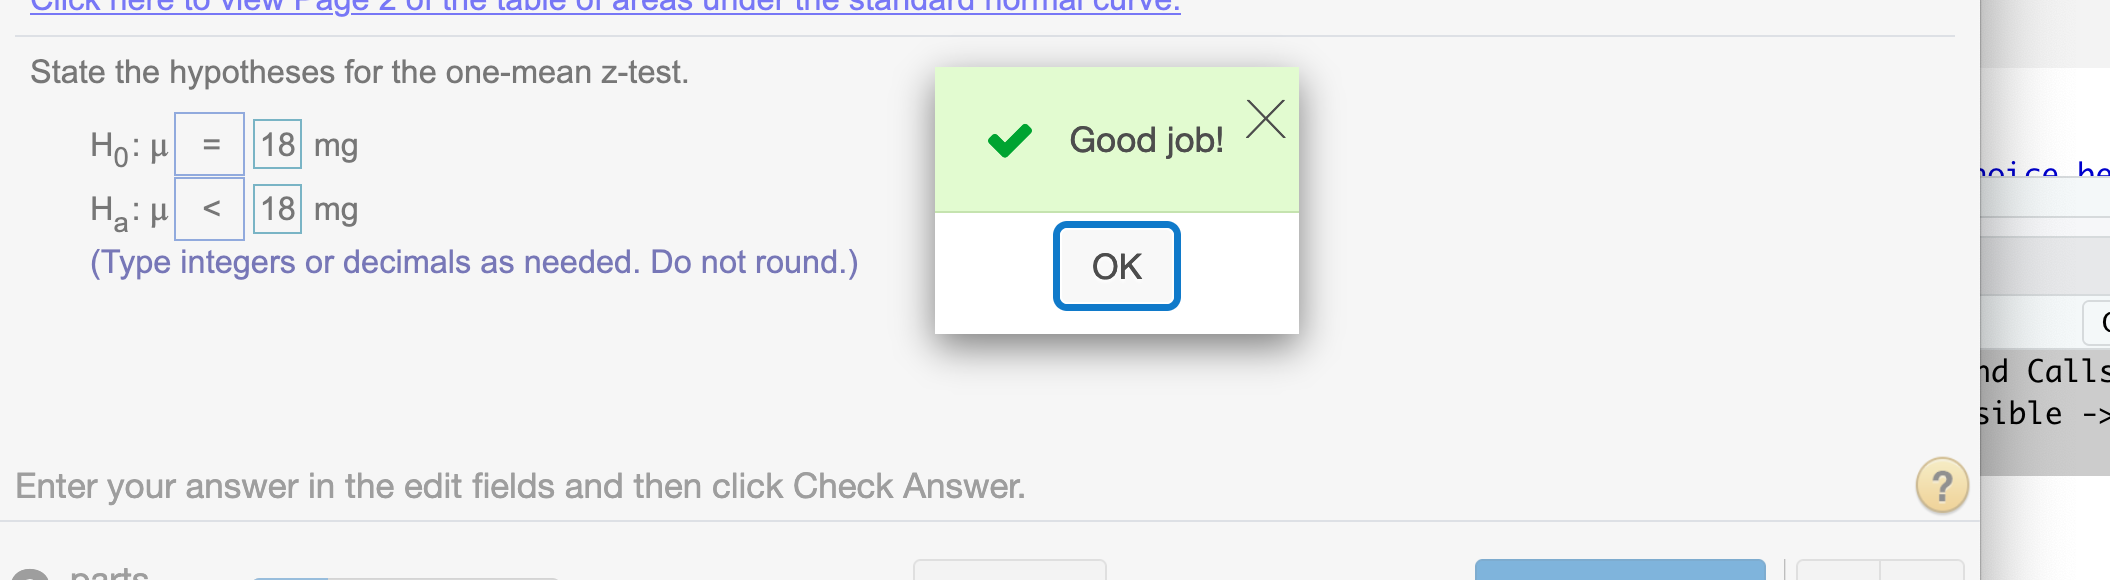
Now, we need to import the data from the question
x = 14.66
mu = 18
n = 45
sigma = 4.6
To get the test statistic z we use the formular \(z = (\bar x-\mu)/(\sigma/\sqrt{n})\), we run
z = (x-mu)/(sigma/sqrt(n))
z
## [1] -4.870739Round the answer to two decimal places
round(z,2)## [1] -4.87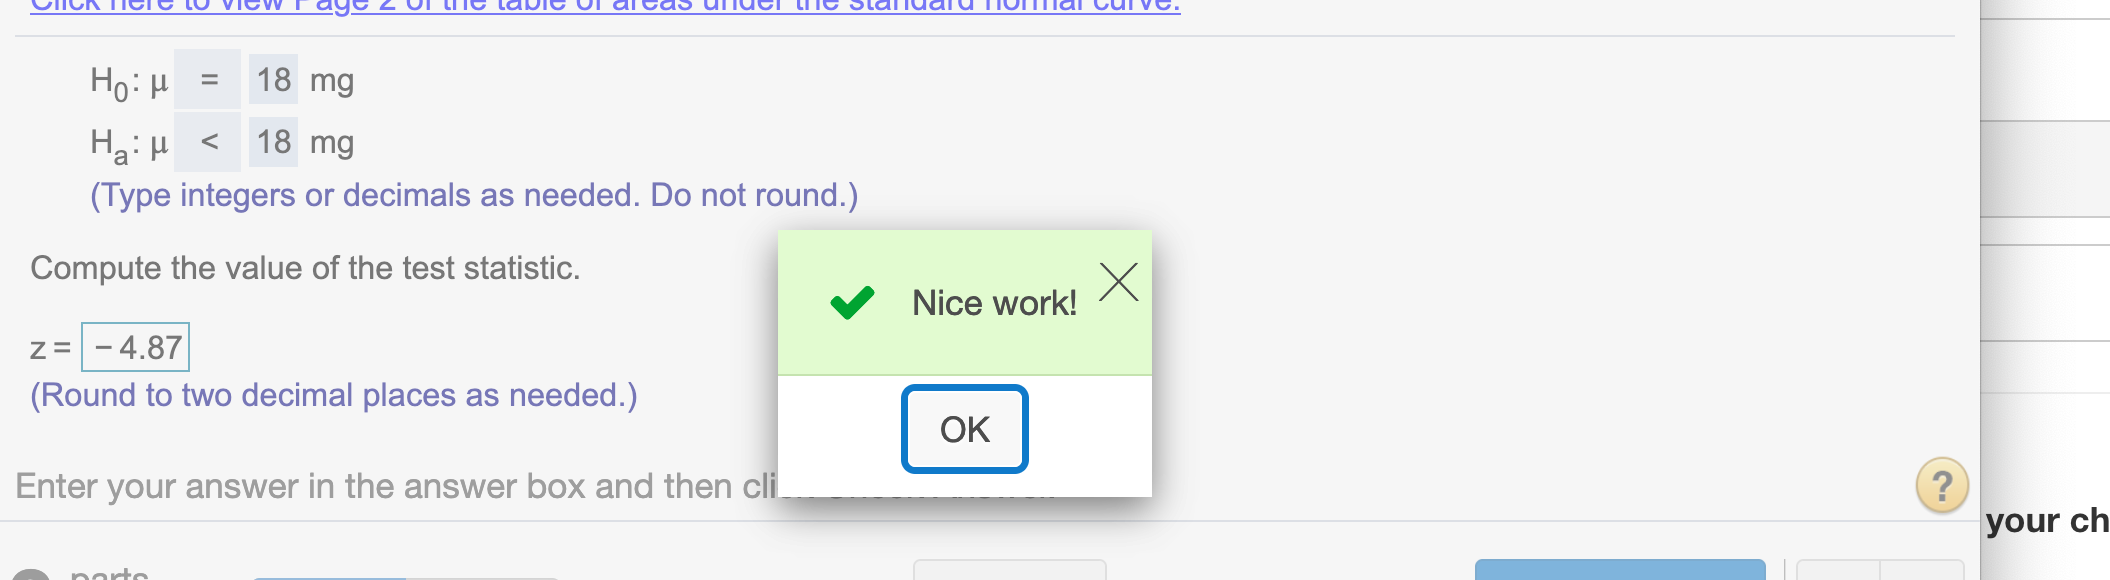
Determine the critical value(s). Select the correct choice below and fill in the answer box within your choice.(Round to two decimal places as needed.).
First, this is a left tail test since \(H_a: \mu < 18\), we have the negative critical value which is on the left of the graph.
Since the significance level is 10%, we can use qnorm() to get the z value
qnorm(.1)## [1] -1.281552Round to two decimal places
round(qnorm(.1), 2)## [1] -1.28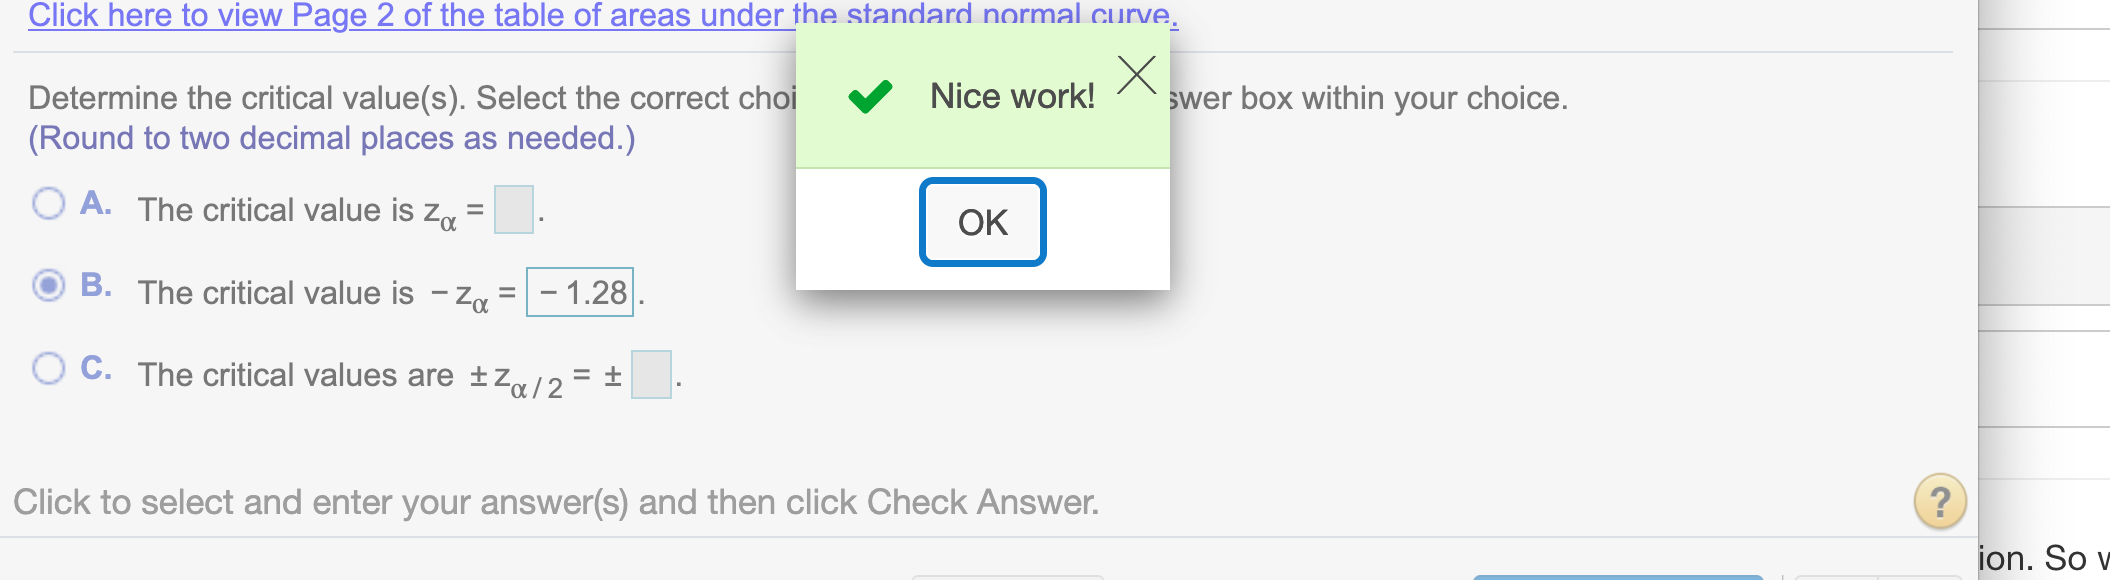
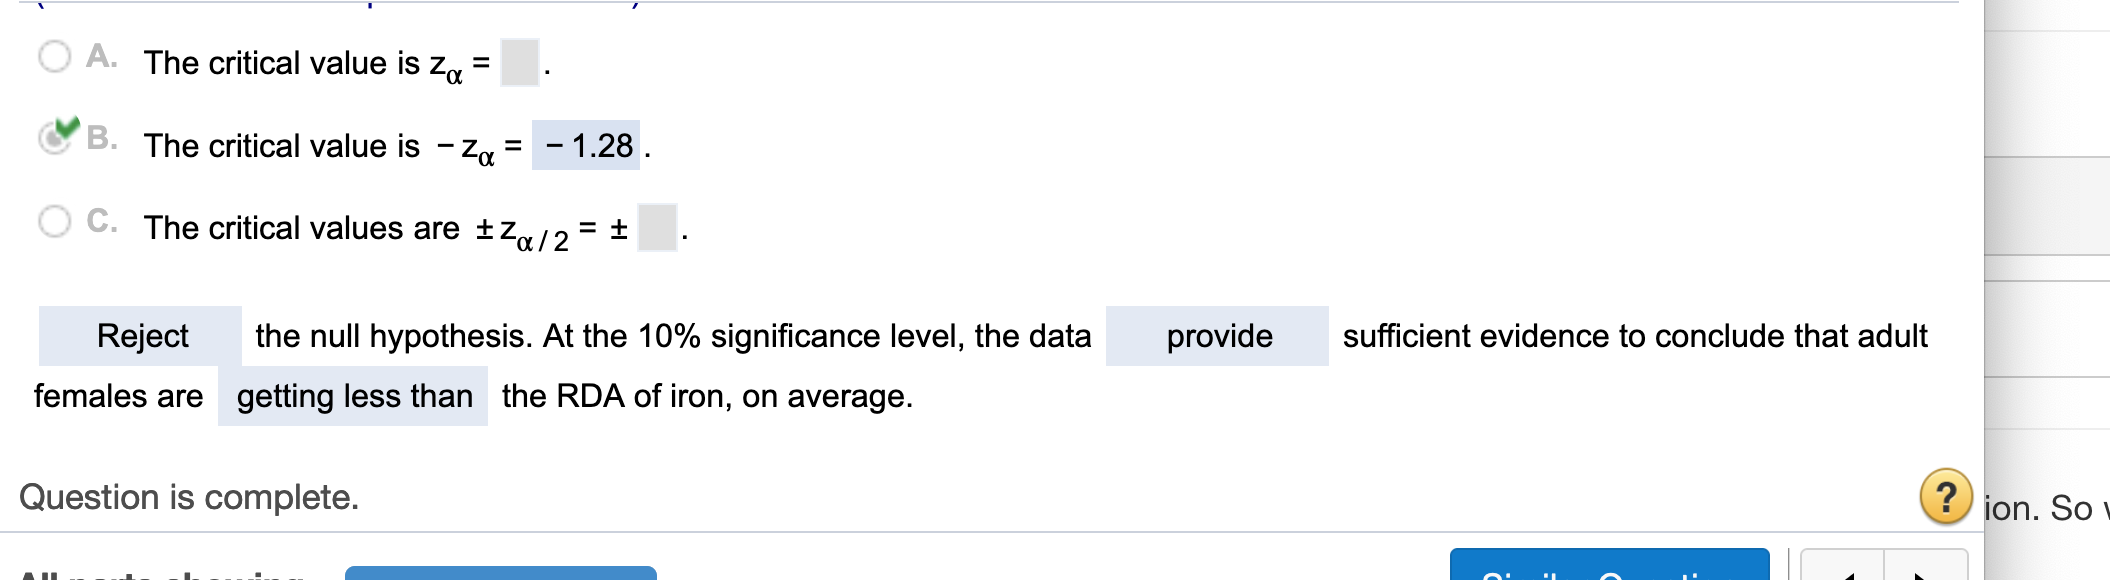
Since our test statistic z = -4.87 < our critical value \(z_{\alpha}\) = -1.28, out test statistic lies in the rejected region. So we have enough evidence to reject null hypothesis.
Hope that helps!